Electrochemical methods– the most dynamically developing in terms of their application in environmental monitoring. The most common methods used in MOS systems are voltammetry (including polarography), potentiometry (including ionometry), coulometry and conductometry.
Electrochemical methods of analysis use the dependence of various electrical properties of the medium on the quantitative content and qualitative composition of the substances analyzed in it:
· change potential electrode depending on the physical and chemical processes occurring in the substance ( potentiometric method), incl. selective reactions of ion-selective electrodes, individually sensitive to a large number of cations and anions ( ionometric method);
· change electrical conductivity (current) and dielectric constant of a substance depending on the nature of the medium and the concentration of its components ( conductometric And amperometric methods);
· changes amount of electricity when the analyte gets into the electrochemical cell ( coulometric method);
· recovery of the analyzed compound on a mercury dripping or rotating electrode, as a rule, when analyzing trace amounts of substances in different states of aggregation ( polarographic or voltammetric method).
Polarographs of all devices in this group have the highest sensitivity, equal to 0.005–1 μg/ml of sample.
Voltammetry includes a group of electrochemical analysis methods based on the study of polarization curves. These methods are polarography And amperometric titration – have many varieties and modifications. Most common constant current polarography.
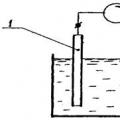
A polarographic installation consists of a direct current source, a voltage divider, a dropping (usually mercury) or rotating electrode and an auxiliary (usually also mercury or other) electrode. To measure the current, a microammeter is connected to the system. The electrodes are placed together with the test solution in an electrolyzer (cell).
Voltage applied to an electrolytic cell causes polarization of the anode and cathode E= f a– f k +iR, Where i– current strength; TO - solution resistance; f a and f k– potentials of the anode and cathode.
If you reduce the resistance of the solution by adding a strong electrolyte (background), then the value iR(potential drop in solution) can be neglected.
The anode potential remains virtually constant during cell operation, since the current density is low and the relatively large surface of the anode is not polarized. Then the potential of a dripping polarizing cathode with a small surface will be equal to: E= -f k. Often in polarographic measurements, instead of a layer of mercury at the bottom of the vessel, a non-polarizing saturated calomel electrode is used, the potential of which is taken equal to zero.
Polarographic data is obtained by measuring the current passing through an electrolytic cell as a function of the potential applied to the electrodes. The graphical dependence of current on potential is called a polarographic wave ( rice. 2).
At the beginning of electrolysis, at low values of the imposed EMF, the current strength will be almost constant and only increase very slowly. This is the so-called residual current, which remains throughout the electrolysis.
Rice. 2. Polarogram of a 10–3 M solution of zinc chloride and a 1 M solution of potassium chloride (curve 1) and a 1 M solution of potassium chloride (curve 2)
As soon as the ion reduction potential is reached (for example, for the determined zinc ions it is equal to -1.0 V), their discharge begins on a drop of mercury:
Zn 2+ + 2 +Hg ® Zn (Hg).
A dilute zinc amalgam Zn (Hg) is formed at the cathode, which decomposes into its constituents as soon as the falling drop comes into contact with the anode:
Zn (Hg) – 2 ® Zn 2+ +Hg.
At the reduction potential of zinc ions, the current strength increases sharply ( rice. 2), but after reaching a certain value, despite the increase in the applied EMF, it remains almost constant. This current is called limiting or diffusion; its value is usually proportional to the concentration of the substance being determined.
When taking polarograms, an indifferent electrolyte with cations that are reduced much more difficult than the analyzed cation is added to the electrolyte under study, for example, KCl, KNO 3, NH 4 Cl; at a concentration 100–1000 times higher than the concentration of the substance being determined. This electrolyte is called “background”. It is created in the test solution to increase electrical conductivity and to shield the electric field of the indicator electrode (cathode). Therefore, the cations of the analyte are not attracted by the electric field of the cathode, but move towards it due to diffusion.
The most important characteristic of a polarogram is the half-wave potential E 1/2 and polarographic wave height h(limit diffusion current). The half-wave potential is used in quality polarographic analysis. The half-wave potentials of various substances, arranged in order of increasing negative value, constitute the so-called “polarographic spectrum”. Since the half-wave potential significantly depends on the composition of the solution (the medium being analyzed), the background is always indicated in polarographic tables.
IN quantitative In polarographic analysis, the methods of calibration graph, additives, comparisons and calculation methods are used to measure concentration.
Among the various options for polarography, the method differential pulse polarography (DIP) ) is most effective for solving environmental monitoring problems, mainly due to its high sensitivity. The DIP method allows you to evaluate the content of all substances determined by classical polarography. Among other polarographic methods, it is especially convenient for trace analysis square wave polarography, which provides a detection limit close to that of DIP, but only in the case of reversible electrode processes, and therefore this method is often used for the determination of traces of heavy metals. The DIP method can also be used to determine surfactants that change the capacitance of the double electrical layer of the electrode.
Methods can be used to determine microcontents of heavy metal ions inversion electrochemical analysis (IEA) or in another way, stripping voltammetric analysis (IVA ), in which the metals to be determined are pre-deposited on the electrode and then dissolved during polarographic control. This option, in combination with DIP, is one of the most sensitive methods of electrochemical analysis. The hardware design of the IEA (IVA) is relatively simple, which makes it possible to carry out analyzes in the field, and automated continuous control (monitoring) stations can also work on this principle.
IEA (IVA) methods provide the determination of Cu, Pb, Bi, Sb, As, Sn In, Ga, Ag, Tl, Cd, Zn, Hg, Au, Ge, Te, Ni, Co ions and many anions. An important advantage of IEA (IEA) methods is (in contrast to other methods, for example, such as atomic absorption spectrometry) ability to distinguish free ions from their bound chemical forms, which is also important for assessing the physicochemical properties of the analyzed substances from the point of view of environmental analytical control (for example, when assessing water quality). Many organic substances can also be determined by IEA (IEA) methods after their adsorption accumulation on the electrode surface.
Polarographic methods can also be used to determine aerosols of various metals in the atmosphere and air of industrial premises after they are captured on appropriate filters, followed by transferring the concentrates into solution. Organic compounds present in the form of gases and vapors in the atmosphere can be determined polarographically after they are absorbed by specially selected solutions. Metals and various compounds in biological materials are usually determined polarographically after their extraction. All polarographic measurements, including IEA (IVA), can be fully automated, which is essential when performing serial analyses.
One of the most important areas of application of polarography is the determination of oxygen in water. For this purpose, amperometric detectors are used, generating a current proportional to the oxygen concentration in the solution.
By applying an enzyme to the surface of the detector membrane, it is possible to obtain various enzyme amperometric sensors convenient for biochemical and clinical analyses. Such sensors are also used in environmental monitoring systems.
Electrodes operating on the electrocatalytic principle are suitable for monitoring various gases (SO 2, H 2 S, CO, NO x) in the air of industrial premises. Electrochemical reactions of these gases (playing the role of a catalyst) occurring on the surface of the electrode generate a current in the electrode system that is functionally related to the concentration of gases in the air.
The use of polarography is not limited to the analysis of discrete samples, and the method is gradually moving to the principles of continuous analysis of gases and liquids.
Voltammetric polarographic detectors have been successfully used in high-performance liquid chromatography (HPLC). In this case, the combination of a highly selective separation method with a sensitive detection method leads to a noticeable expansion of the range of substances determined by the chromatographic method (traces of highly toxic substances, herbicides, drugs, growth stimulants, etc.).
Details of the method can be clarified in the specialized literature.
Potentiometry– a method for determining the concentration of substances, based on measuring the emf of reversible galvanic cells.
In practice, two analytical methods are used: direct potentiometry to determine the particle activity, which can be calculated using the Nernst equation from the emf of the galvanic cell, and potentiometric titration , in which a change in the activity of chemical substances during the titration process leads to a change in the emf of the galvanic cell.
The equipment for carrying out potentiometric titrations and for direct potentiometry is the same. The potentiometric measurement circuit includes an indicator electrode and a reference electrode with a stable constant potential, as well as a secondary device. The principle diagram of the method is shown in rice. 3.

1 – indicator electrode; 2 - reference electrode
Rice. 3. Potentiometric cell
The potential of a pair of electrodes is constant. Changing the concentration of the analyte in the solution changes the EMF of the circuit. Indicator electrodes usually come in four types, depending on the membrane used, which separates the electrode solution from the test solution: 1) electrodes with a homogeneous membrane made of powdery or crystalline material; 2) electrodes with a heterogeneous membrane, in which the electrode active substance is distributed, for example, in silicone rubber; 3) electrodes with a liquid membrane, in which the membrane is a solution applied to a neutral substance, for example, porous glass; 4) glass electrodes with different chemical compositions of glass.
Indicator electrodes acquire the potential of the solution in which they are placed. There are two kind indicator electrodes:
1) indifferent electrodes (non-destructible during electrolysis);
2) electrodes that change (oxidize or reduce) during measurements.
Role indifferent electrodes(these are sometimes called electrodes third kind) is to give or gain electrons, i.e. be conductors of electricity. Such electrodes can be made of gold, polished platinum, graphite and other materials. Examples of variable electrodes (sometimes called electrodes) first kind) may be plates of copper, zinc and other metals, as well as quinhydrone and hydrogen indicator electrodes. In addition, indicator electrodes can be ion selective membrane electrodes for the determination of numerous cations: Li +, Pb +, Cs +, Tl +, NH +, Na +, K +, Ag +, etc. As reference electrodes ( standard electrodes), the potential of which remains constant throughout the measurement, the most commonly used are, for example, normal and decinormal calomel (calomel) electrodes with potentials of +0.282 V and +0.334 V, respectively, as well as a saturated silver chloride electrode with a potential of +0.201 V.
In an ideal case, direct potentiometric measurement of the EMF of a galvanic cell can be related through the Nernst equation to the activity of the particle being determined, or to the concentration, if the corresponding activity coefficients are known:
![]()
Where E 0 – standard electrode potential, V; R– gas constant; T– absolute temperature; F – Faraday number; n– number of electrons lost or gained; , [reduced] – equilibrium concentrations of oxidized and reduced forms, respectively, mol/dm 3 .
If we substitute the reference values of the constants and move from the natural logarithm to the decimal one, then for a temperature of 25°C we get:

The most important indicator in characterizing the state of the environment is the pH value of this environment, the determination of which ( pH-metry ) is currently usually carried out using glass indicator (measuring) electrodes. For long-term measurements, special designs of glass electrodes with additional devices have been developed to ensure cleaning of the glass membrane. Glass electrodes covered with a semi-permeable membrane with an electrolyte film also serve as the basis for various types of probes ( sensors ), used in the analysis of water and air under production conditions for a number of pollutants (NH 3, CO 2, NO x, SO 2, H 2 S, etc.).
The process in the field of creating ion selective electrodes (ISE) allows for monitoring the ions F – , I – , Br – , Cl – , CN – , SCN – , NO 3 – , NO 2 – , ClO 4 – , S 2 – , Na + , K + Ca 2+ , Ag + , Cu 2+ , Cd 2+ , Pb 2+ in concentration ranges from 10 –2 to 10 –7 mol/l (approximately 1–10 –5 mg/ml). Monitoring using ISE is characterized by rapidity, simplicity and greater possibilities for carrying out continuous measurements. ISEs have been developed that are selective to a wide class of organic substances, as well as isomers in their mass, surfactants and detergents found in the air of a production area and the water management regime of industrial enterprises.
Potentiometry is also used in measuring the redox potentials of various redox (O/R) systems in water. As a rule, the measurement results correspond to a mixed potential, since several O/W systems usually coexist simultaneously in water.
It should be noted that the use of sensors based on semiconductor metal oxide chemically selective and ion-selective field-effect transistors (HSFT, ISFT) is promising. Selectivity in these systems is achieved by choosing the composition of the membrane and the layer deposited on the transistor gate. The system is immersed in the solution being analyzed, and the potential difference between the reference electrode and the gate of the transistor modulates the current flowing between its source and drain. Due to the selectivity of the membrane or deposited layer, the modulated current becomes a function of the activity of the corresponding component of the solution. Semiconductor sensors form the basis of monitors and analyzers of various gases and vapors. The small size of such sensors makes it possible to combine them in the form of a mosaic on a single substrate, so that an analyzer is obtained that can monitor a whole range of harmful substances. Signals from individual sensors included in the mosaic can be sequentially and periodically recorded by the measuring center of the analytical system.
The development of microelectronics makes it possible to design compact probe-type analyzers using modern ISEs. In this case, a circuit that processes the response from the environmental control object, and even a display, can be mounted in the probe handle.
In the specialized literature you can find out the details of the method, , , .
Coulometric the analysis method is a measurement of the current of the electrode reaction into which the substance under study enters the coulometric cell with the analyzed flow. The schematic diagram of a coulometric cell is shown in rice. 4.

1 – cathode chamber; 2 – anode chamber; 3 – microammeter
Rice. 4. Schematic of a coulometric cell
Coulometric analysis is based on measuring the amount of electricity spent on quantitatively carrying out a given electrochemical process in a given sample, i.e. provided that the current efficiency is 100%. This is the amount of electricity with the help of a current-time integrator connected in series with the measuring cell, or a coulometer-electrolyzer, in which an electrochemical process is carried out with one hundred percent current efficiency, accompanied by the release of a substance, the amount of which can be easily and accurately restored.
In accordance with Faraday's law:
m( x)/M(x) = m(k)/M(k),
Where m(x), m(k) – mass of the substance being determined X and the substance released in the coulometer, respectively; M(x), M(k) – molar mass of substance equivalents X and substance released in the coulometer, g/mol.

The calculation can also be made using the equation describing Faraday's law:
![]()
if current strength is measured during analysis i, A and time t, s, spent on carrying out the electrochemical process.
In another modification of this method, called
coulometric titration
, the titrant is generated electrolytically in the analyzed solution at a given current. The consumption of the titrant in the analytical reaction is replaced by the charge flowing through the solution when the titrant is generated until the equivalence point is reached.
One of advantages of coulometric methods is that the titrant standardization process is often not necessary, since calculations are based on Faraday's constant, i.e. the method is absolute and allows you to estimate the amount of the substance being determined, and not its concentration. The disadvantage of coulometry with a given potential is the duration of the analysis procedure, associated with the need for complete completion of electrolysis. Computer technology makes it possible to reduce this time by predicting the end of electrolysis by mathematically processing the current-time curve for the initial stages of electrolysis and by calculating the amount of electricity or the concentration of a substance in solution. When analyzing multicomponent samples, it can be used scanning coulometry , in which the electrolysis potential is changed continuously or stepwise. For such systems, coulometric titration is preferable to direct coulometry, since 100% current efficiency in titrant generation can be easily achieved by the correct choice of titrant reagent and composition of the working medium. Coulometric titration is applicable to the determination of substances from 0.01 to 100 mg (sometimes below 1 μg). The working sample volume is usually from 10 to 50 ml. The method is characterized by high accuracy, the relative error does not exceed several tenths of a percent even with coulometric titration of microgram contents. Under optimal conditions, titrations can be performed with very low overall errors of 0.01% (rel.). Various acid-base, redox; Precipitation and complexometric titration options can be carried out coulometrically.
Coulometric gas analyzers and aqua analyzers (“coulometers”) have been developed and produced for the determination of sulfur dioxide and hydrogen sulfide (sulfates and sulfides), ozone (and hydrogen peroxide), chlorine in the air (and active chlorine in water), carbon monoxide and nitrogen dioxide in air (nitrates and nitrites in water). Coulometry is also used as an electrochemical detection tool in liquid chromatography.
Details of the method can be found in specialized literature.
Conductometric method analysis is based on measuring the electrical conductivity of the solution. The conductometric method of analysis consists of measuring the change in the resistance of an electrolyte solution when a component of the mixture is absorbed. Conductometric installations are used, for example, to determine carbon monoxide and dioxide, gasoline vapor, ammonia and others.
Electrical conductivity is the reciprocal of resistance R, its dimension is cm (Siemens) i.e. æ = 1/ R.
The electrical conductivity of a solution depends on the number of ions per unit volume of the solution, i.e. on concentration WITH, on the mobility of these ions – V. Based on known relationships
![]()
Where Z– distance between electrodes; S – electrode area; k– proportionality coefficient.
For a specific pair of electrodes with a constant distance between them S/Z= const. Then
![]() ,
,
Where k 1 = k(S/Z).
When making calculations in conductometry, the concept of “electrical conductivity” æ 0 is used:
![]()
In calculations it is convenient to use the equivalent electrical conductivity, which is equal to:
Where P - number of moles equivalent in 1 cm 3 of solution. The equivalent electrical conductivity l ¥ at infinite dilution is equal to the sum of the cation mobilities U and anion V.
The ratio of the equivalent electrical conductivity of a weak electrolyte solution to the equivalent electrical conductivity of this electrolyte at infinite dilution is equal to the degree of dissociation a of this electrolyte:
Despite its non-specificity, this method is quite often used in environmental monitoring systems compared to other electrochemical methods. This is explained by the fact that when assessing pollution, for example, water and atmosphere, not stage-by-stage, but output (final) control of industrial processes is possible. Due to the extremely low electrical conductivity of water, it is often enough to estimate the total content of contaminants, which is what conductometry provides. Typical examples of the use of conductometric methods in environmental monitoring are analyzers of detergents in wastewater, the concentration of synthetic components in irrigation systems, and the quality (salinity) of drinking water. Conductometric analyzers are used for continuous monitoring of air and precipitation pollutants such as SO 2 and H 2 SO 4 . In addition to direct conductometry can be used to determine certain types of pollution indirect methods, which provide very effective estimates of the content of the substances listed above, which interact before measurement with specially selected reagents and the recorded change in electrical conductivity is caused only by the presence of the corresponding products in the reaction. This way you can determine nitrogen oxides after their catalytic reduction of pre-ammonia, as well as HCl, HBr and CO 2 after a preliminary reaction with Ba(OH) 2 or NaOH. The described principle for determining CO 2 can also be used for the indirect determination of organic substances in water.
In addition to classical conductometry, there is also a high-frequency version ( oscillometry ), in which the indicator electrode system does not contact the sample. This principle is often implemented in continuous conductivity analyzers.
Electrochemical methods of analysis are also described in a number of educational and special publications.
LITERATURE
1. Drugov Yu.S., Rodin A.A.Environmental analytical chemistry.
St. Petersburg: 2002. – 464 p.
2. Pashkevich M.A., Shuisky V.F. Environmental monitoring. Tutorial. St. Petersburg State University. – St. Petersburg, 2002. – 90 p.
3. Cattrall Robert W. Chemical sensors. M.: Scientific world, 2000. – 144 p.
4. Turyan Ya.I., Ruvinsky O.E., Zaitsev P.M.Polarographic catalymetry. M.: Chemistry, 1998. – 272 p.
5. Budnikov G.K., Maistrenko V.N., Murinov Yu.I. Voltammetry with modified and ultramicroelectrodes. M.: Nauka, 1994. – 239 p.
6. Brainina Kh.Z., Neiman E.Ya., Slepushkin V.V. Inversion electroanalytical methods. M.: 1988. – 240 p.
7. Salikhdzhanova R.F. and etc. Polarographs and their use in practical analysis and research. M.: Chemistry, 1988. – 192 p.
8. Kaplan B.Ya., Pats R.G., Salikhdzhanova R.F. AC voltammetry. M.: Chemistry, 1985. – 264.
9. Bond A.M. Polarographic methods in analytical chemistry. M.: Chemistry, 1983.
10. Efremenko O.A. Potentiometric analysis. M.: MMA im. THEM. Sechenova, 1998.
11. Reference Guide to the Application of Ion Selective Electrodes. M.: Mir, 1986.
12. Koryta I. Ions, electrodes, membranes. M.: Mir, 1983.
13. Nikolsky B.V., Materova E.A. Ion selective electrodes. L.: Chemistry, 1980.
14. Efremenko O.A.Coulometric titration. M.: MMA im. THEM. Sechenova, 1990.
15. Khudyakova T.A., Koreshkov A.P. Conductometric method of analysis. Textbook for universities. M.: Higher School, 1975. – 207 p.
16. Budnikov G.K., Maistrenko V.N., Vyaselev M.R. Fundamentals of modern electrical analysis. M.: Chemistry, 2000.
17. Prokhorova G.V. Introduction to electrochemical methods of analysis. M.: Moscow State University Publishing House, 1991. – 97 p.
18. Electroanalytical methods in environmental monitoring. /Ed. R. Kalvoda, R. Zyka, K. Shtulik and others. M.: Chemistry, 1990. – 240 p.
19. Plambeck J.Electrochemical methods of analysis. Fundamentals of theory and application./Trans. from English M.: Mir, 1986.
Description of work
Modern branches of production and social life of people pose their own specific tasks to physical and chemical methods of analysis for product quality control. One of the main physicochemical methods of analysis are electrochemical methods of analysis.
These methods can quickly and fairly accurately determine many product quality indicators.
Electrochemical methods for analyzing the composition of matter are widely used in various industries. They allow you to automate the receipt of results on product quality and correct violations without stopping production. In the food industry, these methods determine the acid-base balance of the product, the presence of harmful and toxic substances and other indicators that affect not only the quality, but also the safety of food.
Equipment designed for electrochemical analysis is relatively cheap, accessible and easy to use. Therefore, these methods are widely used not only in specialized laboratories, but also in many industries.
In this regard, the purpose of this ku
INTRODUCTION 2
THEORETICAL PART 3
1.1 General characteristics of physicochemical methods of analysis 3
1.2 Characteristics of electrochemical methods 4
1.3 Classification of electrochemical methods of analysis 5
2 EXPERIMENTAL-PRACTICAL PART 15
CONCLUSION 21
REFERENCES 22
Introduction
Chapter 1. General concepts. Classification of electrochemical methods of analysis
Chapter 2. Potentiometric methods of analysis (potentiometry)
1 Principle of the method
3 Potentiometric titration
Chapter 3. Conductometric method of analysis
1 Principle of the method. Basic Concepts
2 Principle of conductometry
3 Conductometric titration
Chapter 4. Conductometric analysis (conductometry)
1 Essence of the method
2 Quantitative polarographic analysis
3 Applications of polarography
Chapter 5. Amperometric titration
Chapter 6. Coulometric analysis (coulometry)
1 Principle of the method
3 Coulometric titration
Conclusion
Bibliography
INTRODUCTION
Electrochemical methods of analysis are a set of methods of qualitative and quantitative analysis based on electrochemical phenomena occurring in the medium under study or at the interface and associated with changes in the structure, chemical composition or concentration of the analyte.
Electrochemical methods of analysis are divided into five main groups: potentiometry, voltammetry, coulometry, conductometry and amperometry.
The use of these methods in quantitative analysis is based on the dependence of the values of the measured parameters during the electrochemical process on the separated substance in the analyzed solution participating in this electrochemical process. Such parameters include the difference in electrical potential and the amount of electricity. Electrochemical processes are processes that are simultaneously accompanied by a chemical reaction and a change in the electrical properties of the system, which in such cases can be called an electrochemical system. In analytical practice, an electrochemical system typically contains an electrochemical cell comprising a vessel containing an electrically conductive test solution into which electrodes are immersed.
There are direct and indirect electrochemical methods. In direct methods, the dependence of the current strength (potential, etc.) on the concentration of the component being determined is used. In indirect methods, the current strength (potential, etc.) is measured in order to find the end point of titration of the component being determined with a suitable titrant, that is, the dependence of the measured parameter on the titrant volume is used.
CHAPTER 1. GENERAL CONCEPTS. CLASSIFICATION OF ELECTROCHEMICAL ANALYSIS METHODS
Electroanalytical chemistry includes electrochemical methods of analysis based on electrode reactions and the transfer of electricity through solutions.
The use of electrochemical methods in quantitative analysis is based on the use of dependences of the values of the measured parameters of electrochemical processes (electrical potential difference, current, amount of electricity) on the content of the analyte in the analyzed solution participating in this electrochemical process. Electrochemical processes are processes that are accompanied by the simultaneous occurrence of chemical reactions and a change in the electrical properties of the system, which in such cases can be called an electrochemical system. In analytical practice, an electrochemical system usually contains an electrochemical cell, including a vessel with an electrically conductive test solution in which electrodes are immersed.
Classification of electrochemical methods of analysis. Electrochemical methods of analysis are classified in different ways. Classification is based on taking into account the nature of the source of electrical energy in the system. There are two groups of methods:
a) Methods without imposing external (extraneous) potential.
The source of electrical energy is the electrochemical system itself, which is a galvanic element (galvanic circuit). These methods include potentiometric methods. Electromotive force - EMF - and electrode potentials in such a system depend on the content of the analyte in the solution.
b) Methods with the imposition of external (extraneous) potential. These methods include:
conductometric analysis - based on measuring the electrical conductivity of solutions as a function of their concentration;
voltammetric analysis - based on measuring current as a function of the applied known potential difference and the concentration of the solution;
coulometric analysis - based on measuring the amount of electricity passing through a solution as a function of its concentration;
electrogravimetric analysis - based on measuring the mass of the product of an electrochemical reaction.
Classification according to the method of application of electrochemical methods. There are direct and indirect methods.
a) Direct methods. The electrochemical parameter is measured as a known function of the concentration of the solution and, according to the readings of the corresponding measuring device, the content of the substance being determined in the solution is found.
b) Indirect methods are titration methods in which the end of titration is determined based on measurements of the electrical parameters of the system.
In accordance with this classification, a distinction is made between, for example, direct conductometry and conductometric titration.
CHAPTER 2. POTENTIOMETRIC ANALYSIS METHOD (POTENTIOMETRY)
1 Principle of the method
Potentiometric analysis (potentiometry) is based on the measurement of emf and electrode potentials as a function of the concentration of the analyzed solution.
If in an electrochemical system - in a galvanic cell - a reaction occurs on the electrodes:
aA+bB↔dD + eE
with the transfer of n electrons, then the Nernst equation for the emf E of this reaction has the form:
E꞊E˚- RTnFlnaDda Eea(A)a aBb
where, as usual, E° is the standard EMF of the reaction (the difference in standard electrode potentials), R is the gas constant, T is the absolute temperature at which the reaction occurs, F is the Faraday number; a(A), a(B), a(D) and i(E) - the activities of the reagents participating in the reaction. Equation (10.1) is valid for the emf of a reversibly operating galvanic cell.
For room temperature, equation (10.1) can be represented in the form:
E꞊E˚- 0.059nlnaDda Eea(A)a aBb
Under conditions where the activities of the reagents are approximately equal to their concentrations, equation (1) becomes equation (3):
꞊E˚- RTnFlncDdc EecAa aBb
where c(A), c(B), c(E), c(D) are the concentrations of the reagents. For room temperature, this equation can be represented as (4):
꞊E˚- 0.059nlncDdc EecAa aBb
For potentiometric measurements, two electrodes are used in an electrochemical cell: an indicator electrode, the potential of which depends on the concentration of the analyte (potential-determining) substance in the analyzed solution, and a reference electrode, the potential of which remains constant under analysis conditions. Therefore, the magnitude of the EMF, determined by equations (1)-(4), can be calculated as the difference between the real potentials of these two electrodes.
In potentiometry, the following types of electrodes are used: electrodes of the first, second kind, redox, membrane electrodes.
Electrodes of the first kind are electrodes that are reversible by a cation common to the electrode material. There are three types of electrodes of the first kind.
a) Metal M immersed in a solution of a salt of the same metal. A reversible reaction occurs on the surface of such electrodes:
Mn+ + ne = M
The real potential of such an electrode of the first kind depends on the activity a(Mn+) of metal cations and is described by equations (5)-(8).
In general, for any temperature:
꞊E˚+ RTnFln a(Mn+)
For room temperature:
꞊E˚+ 0.059nln a(Mn+)
At low concentrations c(Mn+), when the activity of a(Mn+) metal cations is approximately equal to their concentration:
꞊E˚+ RTnFln c(Mn+)
For room temperature:
b) Gas electrodes, for example, hydrogen electrode, including standard hydrogen electrode. The potential of a reversibly operating gas hydrogen electrode is determined by the activity of hydrogen ions, i.e. the pH value of the solution, and at room temperature is equal to:
꞊E˚+ 0.059 lg a(H30+) = 0.059 lg a(H3O+) = -0.059рН
since for a hydrogen electrode the standard potential is taken to be zero ( £° =0), and in accordance with the electrode reaction: H++e = N the number of electrons participating in this reaction is equal to one: n = 1. c) Amalgam electrodes, which are a metal amalgam immersed in a solution containing cations of the same metal. The potential of such electrodes of the first kind depends on the activity of a(Mn+) metal cations in solution and the activity of a(M) metal in the amalgam: ꞊E˚+ RTnFlna(Mn+)a(M) Amalgam electrodes are highly reversible. Electrodes of the second type are anion reversible. The following types of electrodes of the second type are distinguished. a) A metal whose surface is coated with a sparingly soluble salt of the same metal, immersed in a solution containing the anions that make up this sparingly soluble salt. An example is the silver chloride electrode Ag|AgCl, KS1 or the calomel electrode Hg|Hg2Cl2, KS1. A silver chloride electrode consists of a silver wire coated with a slightly water-soluble salt, AgCI, immersed in an aqueous solution of potassium chloride. A reversible reaction occurs at the silver chloride electrode The calomel electrode consists of metallic mercury coated with a paste of poorly soluble mercury(1) chloride Hg2Cl2 - calomel, in contact with an aqueous solution of potassium chloride. A reversible reaction occurs at the calomel electrode: Cl2 + 2e = 2Hg + 2SG. The real potential of electrodes of the second kind depends on the activity of the anions and for a reversible electrode on which the reaction occurs: Ne = M + An- described by Nernst equations (9)-(12). In general, at any acceptable temperature T: ꞊E˚- RTnFln a(An-) For room temperature: ꞊E˚- 0.059nln a(An-) For conditions in which the activity of anions is approximately equal to their concentration c(A"~): E꞊E˚- RTnFln c(An-) For room temperature: ꞊E˚- 0.059nln c(An-) For example, the real potentials E1 and E2 of silver chloride and calomel electrodes, respectively, at room temperature can be represented as: ꞊E1˚- 0.0591g a(Cl-),꞊E2˚- 0.0591g a(Cl-). Electrodes of the second type are highly reversible and stable in operation, so they are often used as reference electrodes capable of stably maintaining a constant potential value. b) Gas electrodes of the second type, for example, chlorine electrode Pt, Cl2 KS1. Gas electrodes of the second type are rarely used in quantitative potentiometric analysis. Redox electrodes consist of an inert material (platinum, gold, tungsten, titanium, graphite, etc.) immersed in a solution containing oxidized Ox and reduced Red forms of this substance. There are two types of redox electrodes: a) electrodes whose potential does not depend on the activity of hydrogen ions, for example, Pt | FeCl3, FeCI2, Pt | K3, K4, etc.; b) electrodes whose potential depends on the activity of hydrogen ions, for example, quinhydrone electrode. At the redox electrode, the potential of which does not depend on the activity of hydrogen ions, a reversible reaction occurs: Ox + ne = Red The real potential of such a redox electrode depends on the activity of the oxidized and reduced forms of a given substance and for a reversibly operating electrode is described, depending on the conditions (by analogy with the potentials discussed above), by the Nernst equations (13)-(16): ꞊E˚+ RTnFln a (Ox)a (Red)꞊E˚+ 0.059nlg a (Ox)a (Red)꞊E˚+ RTnFln c(Ox)c (Red)꞊E˚+ 0.059nlg c (Ox) c(Red) If hydrogen ions participate in the electrode reaction, then their activity (concentration) is taken into account in the corresponding Nernst equations for each specific case. Membrane, or ion-selective, electrodes are electrodes that are reversible for certain ions (cations or anions) sorbed by a solid or liquid membrane. The real potential of such electrodes depends on the activity of those ions in the solution that are sorbed by the membrane. Solid membrane electrodes contain a very thin membrane, on both sides of which there are different solutions containing the same ions to be determined, but with different concentrations: a solution (standard) with a precisely known concentration of the ions to be determined, and a solution to be analyzed with an unknown concentration of the ions to be determined. Due to the different concentrations of ions in both solutions, ions on different sides of the membrane are sorbed in unequal quantities, and the electric charge arising from the sorption of ions on different sides of the membrane is also different. As a result, a membrane potential difference arises. Determination of ions using membrane ion-selective electrodes is called ionometry. As mentioned above, in potentiometric measurements, the electrochemical cell includes two electrodes - an indicator electrode and a reference electrode. The magnitude of the EMF generated in the cell is equal to the potential difference between these two electrodes. Since the potential of the reference electrode remains constant under the conditions of potentiometric determination, the EMF depends only on the potential of the indicator electrode, i.e. on the activities (concentrations) of certain ions in solution. This is the basis for the potentiometric determination of the concentration of a given substance in the analyzed solution. To potentiometrically determine the concentration of a substance in a solution, both direct potentiometry and potentiometric titration are used, although the second method is used much more often than the first. Determination of the concentration of a substance in direct potentiometry is usually carried out using the calibration curve method or the standard addition method. a) Calibration graph method. Prepare a series of 5-7 standard solutions with a known content of the analyte. The concentration of the analyte and the ionic strength in the standard solutions should not differ greatly from the concentration and ionic strength of the analyzed solution: under these conditions, determination errors are reduced. The ionic strength of all solutions is maintained constant by introducing an indifferent electrolyte. Standard solutions are sequentially introduced into an electrochemical (potentiometric) cell. Typically this cell is a glass beaker in which an indicator electrode and a reference electrode are placed. The EMF of standard solutions is measured by thoroughly washing the electrodes and glass with distilled water before filling the cell with each standard solution. Based on the data obtained, a calibration graph is constructed in EMF-log c coordinates, where c is the concentration of the analyte in the standard solution. Typically this graph is a straight line. Then the analyzed solution is added to the electrochemical cell (after washing the cell with distilled water) and the emf of the cell is measured. Using the calibration graph, log c(X) is found, where c(X) is the concentration of the analyte in the analyzed solution. b) Standard addition method. A known volume V(X) of the analyzed solution with concentration c(X) is added to the electrochemical cell and the emf of the cell is measured. Then, an accurately measured small volume of a standard solution V(st) with a known, sufficiently large concentration c(st) of the analyte is added to the same solution and the emf of the cell is again determined. Calculate the concentration c(X) of the analyte in the analyzed solution using formula (10.17): c(X)= c(st) V (st)V X+ V (st) Where △ E is the difference between two measured EMF values, n is the number of electrons participating in the electrode reaction. Application of direct potentiometry. The method is used to determine the concentration of hydrogen ions (pH of solutions), anions, and metal ions (ionometry). When using direct potentiometry, the selection of a suitable indicator electrode and accurate measurement of the equilibrium potential play an important role. When determining the pH of solutions, electrodes are used as indicator electrodes, the potential of which depends on the concentration of hydrogen ions: glass, hydrogen, quinhydrone and some others. A membrane glass electrode that is reversible in hydrogen ions is more often used. The potential of such a glass electrode is determined by the concentration of hydrogen ions, therefore the EMF of a circuit including a glass electrode as an indicator is described at room temperature by the equation: K + 0.059рН, where the constant K depends on the membrane material and the nature of the reference electrode. The glass electrode allows you to determine pH in the range pH = 0-10 (more often in the range pH = 2-10) and is highly reversible and stable in operation. The quinhydrone electrode, often used in the past, is a redox electrode whose potential depends on the concentration of hydrogen ions. It consists of a platinum wire immersed in an acid solution (usually HC1) saturated with quinhydrone, an equimolecular compound of quinone and hydroquinone with the composition C6H402 C6H4(OH)2 (dark green powder, slightly soluble in water). Schematic designation of quinhydrone electrode: Pt | quinhydrone, HC1. A redox reaction occurs at the quinhydrone electrode: C6H402 + 2H+ + 2e = C6H4(OH)2 The potential of the quinhydrone electrode at room temperature is described by the formula E°-0.059рН. The quinhydrone electrode allows you to measure the pH of solutions in the range pH = 0-8.5. At pH< 0 хингидрон гидролитически расщепляется: при рН >8.5 hydroquinone, which is a weak acid, undergoes a neutralization reaction. Quinhydrone electrode cannot be used in the presence of strong oxidizing and reducing agents. Membrane ion-selective electrodes are used, as noted above, in ionometry as indicators for determining various cations (Li+, Na+, K+ Mg2t, Ca2+, Cd2+, Fe2+, Ni2+, etc.) ions (F-, Cl-, Br -, I-, S2-, etc.). The advantages of direct potentiometry include the simplicity and speed of measurements; measurements require small volumes of solutions. 3Poteniometric titration Potentiometric titration is a method of determining the volume of titrant spent on titrating the analyte in the analyzed solution by measuring the EMF (during the titration process) using a galvanic circuit composed of an indicator electrode and a reference electrode. In potentiometric titration, the analyzed solution located in an electrochemical cell is titrated a suitable titrant, fixing the end of the titration by a sharp change in the EMF of the measured circuit - the potential of the indicator electrode, which depends on the concentration of the corresponding ions and changes sharply at the equivalence point. The change in the potential of the indicator electrode during the titration process is measured depending on the volume of added titrant. Based on the data obtained, a potentiometric titration curve is constructed and the volume of consumed titrant in the fuel cell is determined from this curve. Potentiometric titration does not require the use of indicators that change color near the fuel element. Application of potentiometric titration. The method is universal; it can be used to indicate the end of titration in all types of titration: acid-base, redox, compleximetric, precipitation, and when titrating in non-aqueous media. Glass, mercury, ion-selective, platinum, and silver electrodes are used as indicator electrodes, and calomel, silver chloride, and glass electrodes are used as reference electrodes. The method has high accuracy and great sensitivity: it allows titration in turbid, colored, non-aqueous media, and the separate determination of mixture components in one analyzed solution, for example, the separate determination of chloride and iodide ions during argentometric titration. Potentiometric titration methods are used to analyze many medicinal substances, for example, ascorbic acid, sulfa drugs, barbiturates, alkaloids, etc. The founder of conductometric analysis is considered to be the German physicist and physical chemist F.V.G. Kohlrausch (1840-1910), who for the first time in 1885 proposed an equation establishing a relationship between the electrical conductivity of solutions of strong electrolytes and their concentration. IN mid 40s XX century a high-frequency conductometric titration method was developed. Since the beginning of the 60s. XX century Conductometric detectors began to be used in liquid chromatography. 1 Principle of the method. Basic Concepts Conductometric analysis (conductometry) is based on the use of the relationship between the electrical conductivity (electrical conductivity) of electrolyte solutions and their concentration. The electrical conductivity of electrolyte solutions - conductors of the second type - is judged on the basis of measuring their electrical resistance in an electrochemical cell, which is a glass vessel (glass) with two electrodes soldered into it, between which the test electrolyte solution is located. An alternating electric current is passed through the cell. Electrodes are most often made of metal platinum, which, to increase the surface of the electrodes, is coated with a layer of spongy platinum by electrochemical deposition of platinum compounds from solutions (platinized platinum electrodes). To avoid complications associated with the processes of electrolysis and polarization, conductometric measurements are carried out in an alternating electric field. The electrical resistance R of the layer of electrolyte solution between the electrodes, like the electrical resistance of conductors of the first kind, is directly proportional to the length (thickness) l of this layer and inversely proportional to the surface area S of the electrodes: R= ρ lS lkS where the proportionality coefficient p is called specific electrical resistance, and the inverse value k = 1/p is called specific electrical conductivity (electrical conductivity). Since the electrical resistance R is measured in ohms, the thickness l of the electrolyte solution layer is in cm, and the surface area S of the electrodes is in cm2, the specific electrical conductivity k is measured in units of Ohm-1 cm-1, or, since Ohm-1 is Siemens (Sm), then - in units of Sm cm-1. In its physical meaning, specific electrical conductivity is the electrical conductivity of an electrolyte layer located between the sides of a cube with a side length of 1 cm, numerically equal to the current passing through a layer of electrolyte solution with a cross-sectional area of 1 cm2 with an applied electric potential gradient of 1 V/cm. Specific electrical conductivity depends on the nature of the electrolyte and solvent, on the concentration of the solution, and on temperature. With increasing concentration of the electrolyte solution, its specific electrical conductivity first increases, then passes through a maximum, and then decreases. This nature of the change in electrical conductivity is due to the following reasons. Initially, with increasing electrolyte concentration, the number of ions - current-carrying particles - increases for both strong and weak electrolytes. Therefore, the electrical conductivity of the solution (electric current passing through it) increases. Then, as the concentration of the solution increases, its viscosity (reducing the speed of movement of ions) and electrostatic interactions between ions increase, which prevents the increase in electric current and, at sufficiently high concentrations, helps to reduce it. In solutions of weak electrolytes, as the concentration increases, the degree of dissociation of electrolyte molecules decreases, which leads to a decrease in the number of ions - conductive particles - and to a decrease in specific electrical conductivity. In solutions of strong electrolytes at high concentrations, the formation of ionic associates (ionic twins, tees, etc.) is possible, which also favors a decrease in electrical conductivity. The specific electrical conductivity of electrolyte solutions increases with increasing temperature due to a decrease in the viscosity of the solutions, which leads to an increase in the speed of movement of ions, and for weak electrolytes, also to an increase in the degree of their ionization (dissociation into ions). Therefore, quantitative conductometric measurements must be carried out at a constant temperature, thermostatting the conductometric cell. In addition to specific electrical conductivity, conductometry uses equivalent electrical conductivity X and molar electrical conductivity p. In physical terms, the equivalent electrical conductivity X is the electrical conductivity of a 1 cm thick layer of electrolyte solution located between identical electrodes with such an area that the volume of the electrolyte solution enclosed between them contains 1 g-equiv of the dissolved substance. In this case, the molar mass of the equivalent is taken to be the molar mass of identical particles with a unit charge number (“charge”), for example, H+, Br -, 12Ca2+, 13Fe3+, etc. The equivalent electrical conductivity increases with decreasing concentration of the electrolyte solution. The maximum value of equivalent electrical conductivity is achieved with infinite dilution of the solution. Equivalent electrical conductivity, like specific conductivity, increases with increasing temperature. The equivalent electrical conductivity X is related to the specific electrical conductivity k by relationship (20): λ= 1000 kc In direct conductometry, the concentration of a substance in the analyzed solution is determined from the results of measurements of the specific electrical conductivity of this solution. When processing measurement data, two methods are used: the calculation method and the calibration graph method. Calculation method. In accordance with equation (10.20), the molar concentration of the equivalent c of the electrolyte in solution can be calculated if the specific electrical conductivity k and the equivalent electrical conductivity are known : c = 1000 kλ Specific electrical conductivity is determined experimentally based on measuring the electrical resistance of a thermostated conductometric cell. Equivalent electrical conductivity of solution λ equal to the sum of the cation mobilities λ+ and anion X λ -:
λ = λ + + λ-
If the mobilities of the cation and anion are known, then the concentration can be calculated using formula (24): c = 1000 kλ + + λ- This is done when determining by direct conductometry the concentration of a poorly soluble electrolyte in its saturated solution (calcium, barium sulfates; silver halides, etc.). Calibration graph method. A series of standard solutions is prepared, each of which contains a precisely known concentration of the analyte, and their electrical conductivity is measured at a constant temperature in a thermostated conductometric cell. Based on the data obtained, a calibration graph is constructed, plotting the concentration of standard solutions on the abscissa axis, and the values of specific electrical conductivity along the ordinate axis. In accordance with equation (24), the plotted graph usually represents a straight line over a relatively small range of concentration changes. In a wide range of concentrations, when the mobilities of the cation and anion included in equation (24) can change noticeably, deviations from the linear dependence are observed. Then, strictly under the same conditions, the specific electrical conductivity k(X) of the electrolyte being determined in the analyzed solution with an unknown concentration c(X) is measured and the desired value c(X) is found from the graph. This is how, for example, the barium content is determined in barite water - a saturated solution of barium hydroxide. Application of direct conductometry. The direct conductometry method is characterized by simplicity and high sensitivity. However, the method is not very selective. Direct conductometry has limited use in analysis. It is used to determine the solubility of poorly soluble electrolytes, to control the quality of distilled water and liquid food products (milk, drinks, etc.), to determine the total salt content in mineral, sea, river water and in some other cases. 3 Conductometric titration In conductometric titration, the progress of titration is monitored by changes in the electrical conductivity of the analyzed solution located in a conductometric cell between two inert electrodes (usually made of platinized platinum). Based on the data obtained, a conductometric titration curve is drawn, reflecting the dependence of the electrical conductivity of the titrated solution on the volume of added titrant. The end point of the titration is most often found by extrapolating sections of the titration curve in the region where its slope changes. In this case, the use of indicators that change color near the TE is not required. In conductometric titration, various types of reactions are used: acid-base, redox, precipitation, complexation processes. Application of conductometric titration. The conductometric titration method has a number of advantages. Titration can be carried out in turbid, colored, opaque media. The sensitivity of the method is quite high - up to ~10~* mol/l; the determination error ranges from 0.1 to 2%. The analysis can be automated. The disadvantages of the method include low selectivity. The concept of high-frequency (radio frequency) conductometric titration. The progress of the titration is monitored using a modified alternating current conductometric technique, in which the alternating current frequency can reach on the order of a million oscillations per second. Typically, the electrodes are placed (applied) on the outside of the titration vessel (conductivity cell) so that they do not come into contact with the solution being titrated. Based on the measurement results, a conductometric titration curve is drawn. The end point of the titration is found by extrapolating sections of the titration curve in the region where its slope changes. CHAPTER 4. CONDUCTOMETRIC ANALYSIS (CONDUCTOMETRY) 4.1 Essence of the method Polarographic analysis (polarography) is based on the use of the following relationships between the electrical parameters of an electrochemical (in this case, polarographic) cell, to which an external potential is applied, and the properties of the analyzed solution contained in it. a) Qualitative polarographic analysis uses the relationship between the magnitude of the external electrical potential applied on the microelectrode, at which reduction (or oxidation) of the analyte is observed on the microelectrode under given conditions, and the nature of the substance being reduced (or oxidized). b) In quantitative polarographic analysis, the relationship between the magnitude of the diffusion electric current and the concentration of the substance being determined (reducing or oxidizing) in the analyzed solution is used. Electrical parameters - the magnitude of the applied electrical potential and the magnitude of the diffusion current - are determined by analyzing the resulting polarization, or current-voltage, curves, which graphically reflect the dependence of the electric current in the polarographic cell on the magnitude of the applied potential of the microelectrode. Therefore, polarography is sometimes called direct voltammetry. The classic polarographic method of analysis using a mercury dropping electrode was developed and proposed in 1922 by the Czech scientist Jaroslav Heyrovsky (1890-1967), although the mercury dropping electrode itself was used by the Czech physicist B. Kucera back in 1903. In 1925 J. Heyrovsky and M. Shikata designed the first polarograph, which made it possible to automatically record polarization curves. Subsequently, various modifications of the polarographic method were developed. The value of the average diffusion current iD is determined by the Ilkovich equation (25): where K is the proportionality coefficient, c is the concentration (mmol/l) of the polarographically active depolarizing substance; iD is measured in microamps as the difference between the limiting current and the residual current. The proportionality coefficient K in the Ilkovich equation depends on a number of parameters and is equal to K=607nD12m23τ16 where n is the number of electrons taking part in the electrode redox reaction; D is the diffusion coefficient of the reducing substance (cm2/s); t is the mass of mercury flowing out of the capillary per second (mg); t is the formation time (in seconds) of a drop of mercury at a half-wave potential (usually it is 3-5 s). Since the diffusion coefficient D depends on temperature, the proportionality coefficient K in the Ilkovich equation changes with temperature. For aqueous solutions in the temperature range of 20-50 °C, the diffusion coefficient of polarographically active depolarizing substances increases by approximately 3% with an increase in temperature by one degree, which leads to an increase in the average diffusion current iD by ~1-2%. Therefore, polarography is carried out at a constant temperature, thermostatting the polarographic cell usually at 25 ± 0.5 ° C. The mass of mercury t and the time of drop formation t depend on the characteristics of the mercury dropping electrode and the height of the mercury column in the capillary and in the reservoir connected to the capillary. The glass capillary of a mercury dripping microelectrode usually has an external diameter of 3-7 mm, an internal diameter of 0.03 to 0.05 mm, and a length of 6-15 cm. The height of the mercury column from the lower end of the capillary to the upper level of the mercury surface in the reservoir is 40-80 cm; The content of the indifferent electrolyte in the analyzed polarographed solution should be approximately 100 times higher than the content of the depolarizing substance being determined, and the ions of the background electrolyte should not be discharged under polarographic conditions until the polarographically active substance is discharged. Polarography is carried out using water, water-organic mixtures (water - ethanol, water - acetone, water - dimethylformamide, etc.) and non-aqueous media (ethanol, acetone, dimethylformamide, dimethyl sulfoxide, etc.) as a solvent. Before polarography begins, a current of inert gas (nitrogen, argon, etc.) is passed through the analyzed solution to remove dissolved oxygen, which also produces a polarographic wave due to reduction according to the following scheme: 2Н+ + 2е = Н202 Н202 + 2Н+ + 2е = 2Н20 Sometimes - in the case of alkaline solutions - instead of passing a current of inert gas, a small amount of an active reducing agent - sodium sulfite, metol - is added to the analyzed solution, which bind dissolved oxygen by reacting with it. 4.2 Quantitative polarographic analysis From the above it follows that quantitative polarographic analysis is based on measuring the diffusion current iD as a function of the concentration of the polarographically active depolarizing substance determined in the polarographed solution. When analyzing the resulting polarograms, the concentration of the analyte is determined using the methods of a calibration curve, standard additions, and standard solutions. a) The calibration curve method is used most often. Using this method, a series of standard solutions are prepared, each of which contains a precisely known concentration of the analyte. Each solution is polarographed (after blowing a current of inert gas through it) under the same conditions, polarograms are obtained and the values of E12 (the same for all solutions) and the diffusion current iD (different for all solutions) are found. Based on the data obtained, a calibration graph is constructed in iD-c coordinates, which is usually a straight line in accordance with the Ilkovich equation. Then, polarography is carried out on the analyzed solution with an unknown concentration c(X) of the analyte, a polarogram is obtained, the diffusion current iD(X) is measured, and the concentration c(X) is found from the calibration graph. b) Standard addition method. A polarogram of the analyzed solution with an unknown concentration c(X) of the analyte is obtained and the value of the diffusion current is found, i.e. height h of the polarogram. Then a precisely known amount of the analyte is added to the analyzed solution, increasing its concentration by value c(st), polarography is carried out again and a new value of the diffusion current is found - the height of the polarogram h + △ h. In accordance with the Ilkovich equation (25), we can write: h = Kc(X), △ h = Kc(st), where h △ h = c(X)c(st) and c(X) = h △ hc(st) c) Standard solution method. Under identical conditions, polarography is carried out on two solutions: an analyzed solution with an unknown concentration c(X) and a standard solution with a precisely known concentration c(st) of the substance being determined. From the resulting polarograms, the heights of the polarographic waves h(X) and h(st) are found, corresponding to the diffusion current at concentrations c(X) and c(st), respectively. According to the Ilkovich equation (25) we have: (X) = Kc(X), h(st) = Kc(st), The standard solution is prepared so that its concentration is as close as possible to the concentration of the solution being determined. Under this condition, the determination error is minimized. 3 Applications of polarography Application of the method. Polarography is used to determine small quantities of inorganic and organic substances. Thousands of quantitative polarographic analysis techniques have been developed. Methods have been proposed for the polarographic determination of almost all metal cations, a number of anions (bromate, iodate, nitrate, permanganate ions), organic compounds of various classes containing diazo groups, carbonyl, peroxide, epoxy groups, double carbon-carbon bonds, as well as bonds carbon-halogen, nitrogen-oxygen, sulfur-sulfur. The pharmacopoeial method is used for the determination of salicylic acid, norsulfazole, vitamin B alkaloids, folic acid, kellin in powder and tablets, nicotinamide, pyridoxine hydrochloride, arsenic preparations, cardiac glycosides, as well as oxygen and various impurities in pharmaceuticals. The method has high sensitivity (up to 10"5-10T6 mol/l); selectivity; relatively good reproducibility of results (up to ~2%); wide range of applications; allows you to analyze mixtures of substances without their separation, colored solutions, small volumes of solutions (volume of polarographic cells can be as small as 1 ml); carry out analysis in a flow of solution; automate the analysis." The disadvantages of the method include the toxicity of mercury, its fairly easy oxidation in the presence of oxidizing substances, and the relative complexity of the equipment used. Other variants of the polarographic method. In addition to the classical polarography described above, which uses a dripping mercury microelectrode with an electrical potential uniformly increasing on it at a constant electric current, other variants of the polarographic method have been developed - derivative, differential, pulse, oscillographic polarography; alternating current polarography - also in different versions. CHAPTER 5. AMPEROMETRIC TITRATION The essence of the method. Amperometric titration (potentiostatic polarization titration) is a type of voltammetric method (along with polarography). It is based on measuring the current between the electrodes of an electrochemical cell, to which a certain voltage is applied, as a function of the volume of added titrant. In accordance with the Ilkovich equation (25): The diffusion current iD in the polarographic cell is greater, the higher the concentration c of the polarographically active substance. If, when adding a titrant to the analyzed titrated solution located in a polarographic cell, the concentration of such a substance decreases or increases, then the diffusion current also decreases or increases accordingly. The equivalence point is determined by a sharp change in the decrease or increase in the diffusion current, which corresponds to the end of the reaction of the titrated substance with the titrant. A distinction is made between amperometric titration with one polarizable electrode, also called titration by limiting current, polarographic or polarimetric titration, and amperometric titration with two identical polarizable electrodes, or titration “until the current stops completely”, biamperometric titration. Amperometric titration with one polarizable electrode. It is based on measuring the current in a polarographic cell depending on the amount of added titrant at a constant external potential on the microelectrode, slightly higher than the half-wave potential on the current-voltage curve of the titrated substance X or titrant T. Typically, the selected external potential corresponds to the current limiting region on the polarogram X or T Titration is carried out on an installation consisting of a direct current source with adjustable voltage, to which a galvanometer and a polarographic titration cell are connected in series. The working (indicating) electrode of the cell can be a mercury dropping electrode, a stationary or rotating platinum or graphite electrode. When using solid electrodes, it is necessary to stir the solution during titration. Silver chloride or calomel electrodes are used as a reference electrode. The background is, depending on the conditions, various polarographically inactive electrolytes at a given potential (HN03, H2S04, NH4NO3, etc.). First, current-voltage curves (polarograms) are obtained for X and T under the same conditions under which amperometric titration is supposed to be carried out. Based on consideration of these curves, a potential value is selected at which the limiting current value of the polarographically active X or T is achieved. The selected potential value is maintained constant throughout the titration process. The titrant concentration T used for amperometric titration should be approximately 10 times higher than the concentration X; in this case, there is practically no need to introduce a correction for solution dilution during titration. Otherwise, all the conditions required to obtain polarograms are met. The requirements for thermostating are less stringent than for direct polarography, since the end of titration is determined not by the absolute value of the diffusion current, but by a sharp change in its value. The analyzed solution containing X is added to the polarographic cell, and the titrant T is added in small portions, measuring the current i each time. The magnitude of the current i depends on the concentration of the polarographically active substance. At the equivalence point, the value of i changes sharply. Based on the results of amperometric titration, titration curves are constructed. An amperometric titration curve is a graphical representation of the change in current / as a function of the volume V of added titrant. The titration curve is plotted in the coordinates current i - volume V of the added titrant T (or degree of titration). Depending on the nature of the titrated substance X and the titrant T, amperometric titration curves can be of different types. Biamperometric titration is carried out with vigorous stirring of the solution in a setup consisting of a direct current source with a potentiometer, from which an adjustable potential difference (0.05-0.25 V) is supplied through a sensitive microammeter to the electrodes of the electrochemical cell. Before titration, the solution to be titrated is added to the latter and the titrant is added in portions until the current abruptly stops or appears, as judged by the reading of a microammeter. The platinum electrodes used in the electrochemical cell are periodically cleaned by immersing them for ~30 minutes in boiling concentrated nitric acid containing ferric chloride additives, followed by washing the electrodes with water. Biamperometric titration is a pharmacopoeial method; used in iodometry, nitritometry, aquametry, and for titration in non-aqueous media. CHAPTER 6. COULOMETRIC ANALYSIS (COULOMETRY) 1 Principles of the method electrochemical conductometry titration coulometry Coulometric analysis (coulometry) is based on the use of the relationship between the mass m of a substance that reacted during electrolysis in an electrochemical cell and the amount of electricity Q passed through the electrochemical cell during the electrolysis of only this substance. In accordance with Faraday's unified law of electrolysis, the mass m (in grams) is related to the amount of electricity Q (in coulombs) by the relation (27) where M is the molar mass of the substance that reacted during electrolysis, g/mol; n is the number of electrons participating in the electrode reaction; 96487 C/mol is the Faraday number. The amount of electricity Q (in C) passed through an electrochemical cell during electrolysis is equal to the product of electric current i (in A) and the time of electrolysis τ ( in c): If the amount of electricity Q is measured, then according to (27) the mass m can be calculated. This is true in the case when the entire amount of electricity Q passed through the electrochemical cell during electrolysis is spent only on the electrolysis of a given substance; side processes must be excluded. In other words, the current output (efficiency) must be 100%. Since, in accordance with M. Faraday’s unified law of electrolysis, in order to determine the mass t (g) of a substance reacted during electrolysis, it is necessary to measure the amount of electricity Q spent on the electrochemical transformation of the substance being determined, in coulombs, the method is called coulometry. The main task of coulometric measurements is to determine the amount of electricity Q as accurately as possible. Coulometric analysis is carried out either in amperostatic (galvanostatic) mode, i.e. with a constant electric current i=const, or with a controlled constant potential of the working electrode (potentiostatic coulometry), when the electric current changes (decreases) during the electrolysis process. In the first case, to determine the amount of electricity Q, it is enough to measure the electrolysis time t(s), direct current /(A) as accurately as possible and calculate the value of Q using formula (10.28). In the second case, the value of Q is determined either by calculation or using chemical coulometers. There are direct coulometry and indirect coulometry (coulometric titration). The essence of the method. Direct coulometry at constant current is rarely used. More often, coulometry is used with a controlled constant potential of the working electrode or direct potentiostatic coulometry. In direct potentiostatic coulometry, the substance being determined is directly electrolyzed. The amount of electricity spent on the electrolysis of this substance is measured, and the mass m of the substance being determined is calculated using the equation. During the electrolysis process, the potential of the working electrode is maintained constant, E = const, for which devices - potentiostats - are usually used. The constant value of the potential E is selected in advance based on consideration of the current-voltage (polarization) curve constructed in the coordinates current i - potential E (as is done in polarography), obtained under the same conditions in which electrolysis will be carried out. Typically, a potential value E is selected that corresponds to the limiting current region for the substance being analyzed and is slightly higher than its half-wave potential E12 (by -0.05-0.2 V). At this potential value, as in polarography, the background electrolyte should not undergo electrolysis. As the electrolysis process proceeds at a constant potential, the electric current in the cell decreases, as the concentration of the electroactive substance participating in the electrode reaction decreases. In this case, the electric current decreases over time according to an exponential law from the initial value i0 at time t = O to value i at time t: where the coefficient k depends on the nature of the reaction, the geometry of the electrochemical cell, the area of the working electrode, the diffusion coefficient of the substance being determined, the speed of stirring the solution and its volume. Methods for determining the amount of electricity passed through a solution in direct potentiostatic coulometry. The value of Q can be determined by calculation methods or using a chemical coulometer. a) Calculation of quantity Q from the area under the curve of i versus m. To determine Q without noticeable error, the method requires almost complete completion of the electrolysis process, i.e. for a long time. In practice, as noted above, the area is measured at a value of m corresponding 0.001i0 (0.1% of i0). b) Calculation of the value of Q based on the dependence of In / on m. In accordance, we have: Q = 0∞i0e-k τ d τ =i00∞e-k τ d τ =i0k Because the ∞i0e-k τ d τ = - k-1 e-k∞-e-k0= k-10-1=k-1 Application of direct coulometry. The method has high selectivity, sensitivity (up to 10~8-10~9 g or up to ~10~5 mol/l), reproducibility (up to ~1-2%), and allows determining the content of microimpurities. The disadvantages of the method include the high labor intensity and duration of the analysis, and the need for expensive equipment. Direct coulometry can be used to determine - during cathodic reduction - metal ions, organic nitro- and halogen derivatives; during anodic oxidation - chloride, bromide, iodide, thiocyanate anions, metal ions in lower oxidation states when converting them to higher oxidation states, for example: As(IH) -> As(V),Cr(II) - > Cr(III), Fe(II) -» Fe(III), T1(I) -> Tl(III), etc. In pharmaceutical analysis, direct coulometry is used to determine ascorbic and picric acids, novocaine, hydroxyquinoline and in some other cases. As noted above, direct coulometry is quite labor-intensive and time-consuming. In addition, in some cases, side processes begin to occur noticeably even before the completion of the main electrochemical reaction, which reduces the current efficiency and can lead to significant analysis errors. Therefore, indirect coulometry - coulometric titration - is more often used. 3 Coulometric titration The essence of the method. In coulometric titration, the analyte X, which is in solution in an electrochemical cell, reacts with the “titrant” T, a substance continuously formed (generated) on the generator electrode during the electrolysis of an auxiliary substance also present in the solution. The end of titration - the moment when all the analyte X has completely reacted with the generated “titrant” T, is recorded either visually by the indicator method, introducing into the solution an appropriate indicator that changes color near the TE, or using instrumental methods - potentiometrically, amperometrically, photometrically. Thus, in a coulometric titration, the titrant is not added from the burette to the solution being titrated. The role of the titrant is played by substance T, which is continuously generated during the electrode reaction on the generator electrode. Obviously, there is an analogy between conventional titration, when the titrant is introduced from the outside into the titrated solution and, as it is added, reacts with the analyte, and the generation of substance T, which, as it is formed, also reacts with the analyte. Therefore, the method under consideration is called “coulometric titration”. Coulometric titration is carried out in amperostatic (galvanostatic) or potentiostatic mode. More often, coulometric titration is carried out in amperostatic mode, maintaining the electric current constant throughout the entire electrolysis time. Instead of the volume of added titrant, in coulometric titration the time t and current i of electrolysis are measured. The process of formation of substance T in a coulometric cell during electrolysis is called titrant generation. Coulometric titration at constant current. During coulometric titration in amperostatic mode (at constant current), the time t during which electrolysis was carried out is measured, and the amount of electricity Q consumed during electrolysis is calculated using the formula, after which the mass of the analyte X is found by the ratio. So, for example, the standardization of a solution of hydrochloric acid HC1 by the method of coulometric titration is carried out by titrating hydrogen ions H30+ of the standardized solution containing HC1, electrically generated at the platinum cathode by hydroxide ions OH- during the electrolysis of water: Н20 + 2е = 20Н- + Н2 The resulting titrant - hydroxide ions - reacts with H30+ ions in solution: H30+ + OH- = 2H20 Titration is carried out in the presence of the indicator phenolphthalein and is stopped when a light pink color of the solution appears. Knowing the magnitude of direct current i (in amperes) and the time t (in seconds) spent on titration, the amount of electricity Q (in coulombs) is calculated using formula (28) and the mass (in grams) of reacted HC1 contained in formula (27). in an aliquot of the standardized HC1 solution added to the coulometric cell (into the generator vessel). Conditions for coulometric titration. From the above it follows that the conditions for carrying out coulometric titration must ensure 100% current efficiency. To do this, you must fulfill at least the following requirements. a) The auxiliary reagent from which the titrant is generated at the working electrode must be present in the solution in a large excess relative to the substance being determined (~ 1000-fold excess). Under these conditions, side electrochemical reactions are usually eliminated, the main of which is the oxidation or reduction of the background electrolyte, for example, hydrogen ions: Н+ + 2е = Н2 b) The value of direct current i=const during electrolysis must be less than the value of the diffusion current of the auxiliary reagent in order to avoid a reaction involving ions of the background electrolyte. c) It is necessary to determine as accurately as possible the amount of electricity consumed during electrolysis, which requires accurately recording the beginning and end of the time count and the magnitude of the electrolysis current. Coulometric titration at constant potential. The potentiostatic mode is used less frequently in coulometric titrations. Coulometric titration in potentiostatic mode is carried out at a constant potential value corresponding to the potential of the discharge of a substance on the working electrode, for example, during the cathodic reduction of metal cations M "* on a platinum working electrode. As the reaction proceeds, the potential remains constant until all metal cations react , after which it sharply decreases, since there are no longer potential-determining metal cations in the solution. Application of coulometric titration. In coulometric titration, all types of titrimetric analysis reactions can be used: acid-base, redox, precipitation, complexation reactions. Thus, small amounts of acids can be determined by coulometric acid-base titration with electrogenerated OH- ions formed during the electrolysis of water at the cathode: Н20 + 2е = 20Н" + Н2 Bases can also be titrated with hydrogen ions H+ generated at the anode during the electrolysis of water: Н20-4е = 4Н+ + 02 With redox bromometric coulometric titration, it is possible to determine compounds of arsenic(III), antimony(III), iodides, hydrazine, phenols and other organic substances. Bromine, which is electrically generated at the anode, acts as a titrant: VG -2e = Vg2 Precipitative coulometric titration can determine halide ions and organic sulfur-containing compounds by electrogenerated silver cations Ag+, zinc cations Zn2+ by electrogenerated ferrocyanide ions, etc. Complexometric coulometric titration of metal cations can be carried out with EDTA anions electrogenerated on a mercury(I) complexonate cathode. Coulometric titration has high accuracy, a wide range of applications in quantitative analysis, allows you to determine small amounts of substances, low-resistant compounds (since they react immediately after their formation), for example, copper (1), silver (H), tin (P), titanium(III), manganese(III), chlorine, bromine, etc. The advantages of the method also include the fact that preparation, standardization and storage of the titrant are not required, since it is continuously formed during electrolysis and is immediately consumed in the reaction with the substance being determined. CONCLUSION Electrochemical methods of analysis are based on processes occurring on electrodes or the interelectrode space. Electrochemical methods of analysis are among the oldest physicochemical methods of analysis (some were described in the late 19th century). Their advantage is high accuracy and comparative simplicity of both equipment and analysis techniques. High accuracy is determined by very precise laws used in electrochemical methods of analysis, for example, Faraday's law. A great convenience is that they use electrical influences, and the fact that the result of this influence (response) is then obtained in the form of an electrical signal. This ensures high speed and accuracy of reading and opens up wide possibilities for automation. Electrochemical methods of analysis are distinguished by good sensitivity and selectivity; in some cases they can be classified as microanalysis, since sometimes less than 1 ml of solution is sufficient for analysis. Their instrument is an electrochemical cell, which is a vessel with an electrolyte solution in which at least two electrodes are immersed. Depending on the problem being solved, the shape and material of the vessel, the number and nature of electrodes, solution, and analysis conditions (applied voltage (current) and recorded analytical signal, temperature, stirring, purging with an inert gas, etc.) may vary. The substance being determined can be part of both the electrolyte filling the cell and one of the electrodes. Electrochemical methods of analysis play an important role in the modern world. In our time, taking care of the environment is especially important. Using these methods, it is possible to determine the content of a huge number of different organic and inorganic substances. They are now more effective at identifying hazardous substances.
Send your good work in the knowledge base is simple. Use the form below
Students, graduate students, young scientists who use the knowledge base in their studies and work will be very grateful to you.
Posted on http://www.allbest.ru
Ministry of Education and Science of the Russian Federation
Federal State Budgetary Educational Institution
higher education
"Irkutsk National Research Technical University"
Department of Metallurgy of Non-Ferrous Metals
(name of the department)
"Electrochemical research methods"
Abstract on the discipline
“Physico-chemical methods for studying metallurgical processes”
Completed by a student from group MCM-16-1
Zakharenkov R.I.
Checked by the teacher of the MCM department
Kuzmina M.Yu.
Irkutsk 2017
INTRODUCTION
Electrochemistry is a branch of physical chemistry that considers systems containing ions (solutions or melts of electrolytes) and processes occurring at the boundary of two phases with the participation of charged particles.
The first ideas about the relationship between chemical and electrical phenomena were known in the 18th century, since a huge number of physical and chemical experiments were carried out with electric and lightning discharges, with charges located in Leyden jars, but all of them were random in nature due to the lack of constant powerful source of electrical energy. The origin of electrochemistry is associated with the names of L. Galvani and A. Volta. While studying the physiological functions of the frog, Galvani accidentally created an electrochemical circuit. It consisted of two different metals and a prepared frog's leg. The paw was both an electrolyte and an indicator of electric current, but the conclusion was given incorrectly, i.e., according to Galvani, this electric current that arose in the circuit was of animal origin, i.e., it was associated with the functional characteristics of the frog’s body (theory “ animal electricity").
The correct interpretation of Galvani's experiments was given by A. Volta. He created the first battery of galvanic cells - a voltaic column. The battery cells consisted of copper and zinc disks, and the electrolyte was a sponge material soaked in salt water or acid. It was this connection that made it possible to obtain electric current. Soon, through the works of the great scientists A. Volta, J. Daniel, B. S. Jacobi, P. R. Bagration, G. Plante and others, powerful galvanic cells and batteries, easy to use, appeared. Then A. Volta developed a series of metal voltages. If two different metals are brought into contact and then separated, then using physical means, such as an electroscope, it can be seen that one metal has acquired a positive charge and the other a negative one. This series of metals, in which each preceding metal is charged positively, but after contact with any subsequent one, i.e. the Volta series, turned out to be similar to the voltage series.
Further, at the beginning of the 19th century, electrolysis was developed, and M. Faraday established the quantitative laws of electrolysis. Scientists made a great contribution to the development of electrochemistry: S. A. Arrhenius, V. F. Ostwald, R. A. Colley, P. Debye, W. Nernst, G. Helmholtz, etc. Now electrochemistry is divided into theoretical and applied. Through the use of electrochemical methods, it is connected with other branches of physical chemistry, as well as with analytical chemistry and other sciences.
electrochemical potentiometry conductometry coulometry
1 . ELECTROCHEMICAL METHODS OF RESEARCH
The need to use a variety of methods to study electrochemical processes is due to the wide range of variations in the rate of electron transfer in electrode reactions. Each of the methods has a certain limit on the determined value of the exchange current density, above which the electrochemical parameters of the electrode reaction cannot be determined. In relation to each specific object, it is necessary to choose the method that provides the maximum amount of reliable information. When conducting electrochemical studies, it is necessary to know the chemical composition of the starting substances and reaction products. To determine the composition of the electrolyte, various physical and chemical methods are used: spectrophotometric, potentiometric, analytical and others. When conducting electrochemical studies, the following conditions must be observed.
1. Maximum purity of the reagents used; the composition of the electrodes must be strictly known, as well as the condition of their surfaces. Care should be taken to ensure that the surface of the electrodes does not undergo changes during the measurement process.
2. The design of the electrochemical cell and the electrodes located in it must ensure uniform distribution of current over the entire surface of the working electrode.
3. Measurements should be carried out at strictly controlled temperatures.
4. Maintain constant pressure and composition of the gas phase above the electrolyte. As a rule, studies are carried out in an inert gas environment (N 2, Ar, Ne, He H 2), since oxygen in the gas phase can have a significant effect on the mechanism of the process.
5. It is necessary to ensure such experimental conditions under which the potential drop in the diffuse part of the electrical double layer would be minimal or precisely known. To reduce this potential, as a rule, a background electrolyte is used, the concentration of which should be no less than 20 times higher than that of the main substance. However, you must first make sure that the background electrolyte does not distort the polarization curve of the reaction being studied.
6. Accurate measurement of working electrode potential. To do this, it is necessary to eliminate the diffusion potential between the electrolyte under study and the electrolyte of the reference electrode. This potential takes on its maximum value when approaching the limiting current and can significantly distort the measurement results. To eliminate the diffusion potential between the electrolyte under study and the electrolyte of the reference electrode, it is desirable: a) select a reference electrode that has the same electrolyte composition as the one being studied. For example, when researching in chloride solutions, it is convenient to use silver chloride, calomel, and chlorine electrodes; in acidic sulfate solutions - mercury-sulfate electrodes, etc.; b) use a reference electrode with an electrolyte at the boundary of which with the electrolyte under study the diffusion potential can be calculated using known formulas.
When measuring in solutions with a constant ionic strength, and at high background concentrations - with a constant ionic concentration, you can, in principle, use any reference electrode. The diffusion potential in this case can be very large, but also constant - it can be calculated or determined experimentally.
In all cases of studying the kinetics of electrochemical processes, it is necessary to measure the current density. Usually they start by finding out using analytical chemistry and coulometry methods to determine whether only one reaction under study occurs at the electrode or whether it is complicated by side reactions. In the case of side reactions, it is necessary to find out what proportion of the current is due only to the implementation of the reaction being studied (construct the so-called partial polarization characteristic for the reaction being studied).
The mechanism of the electrode reaction can be most simply interpreted only in the case when the starting substance is converted into one product with 100% current efficiency. Checking the reaction for compliance with Faraday's law or performing coulometric measurements allows you to simultaneously determine the number of electrons participating in the total electrode reaction. Knowing the composition of the starting substance and the reaction product, as well as the total number of transferred electrons, makes it possible to write down the equation for the total electrode reaction.
The next step in studying the mechanism of the electrode reaction is to find out which stage is limiting.
If the limiting stage is the discharge-ionization stage, and all others proceed reversibly, then the main kinetic parameters of the process can be determined graphically or analytically by applying the equations of the slow discharge theory to the polarization characteristics.
1.1 Electrochemical methods of analysis
Electrochemical methodsanalysis is a set of methods of qualitative and quantitative analysis based on electrochemical phenomena occurring in the medium under study or at the interface and associated with changes in the structure, chemical composition or concentration of the analyzed substance.
There are direct and indirect electrochemical methods. Direct methods use the dependence of the current strength (potential, etc.) on the concentration of the component being determined. In indirect methods, the current strength (potential, etc.) is measured in order to find the end point of titration of the analyte with a suitable titrant, i.e. The dependence of the measured parameter on the titrant volume is used.
For any kind of electrochemical measurements, an electrochemical circuit or electrochemical cell is required, of which the analyzed solution is an integral part.
Electrochemical methods are classified depending on the type of phenomena measured during the analysis process. There are two groups of electrochemical methods:
1. Methods without imposing extraneous potential, based on measuring the potential difference that occurs in an electrochemical cell consisting of an electrode and a vessel with the test solution. This group of methods is called potentiometric. Potentiometric methods use the dependence of the equilibrium potential of the electrodes on the concentration of ions participating in the electrochemical reaction on the electrodes.
2. Methods with the imposition of extraneous potential, based on measurement:
a) Electrical conductivity of solutions? conductometry;
b) The amount of electricity passing through the solution? coulometry;
c) Dependence of the current on the applied potential? volt-amperometry;
d) The time required for the electrochemical reaction to occur - chronoelectrochemical methods(chronovoltammetry, chronoconductometry).
In the methods of this group, an extraneous potential is applied to the electrodes of the electrochemical cell.
The main element of instruments for electrochemical analysis is the electrochemical cell. In methods without imposing extraneous potential, it is galvanic cell, in which an electric current occurs due to chemical redox reactions. In a cell such as a galvanic cell, two electrodes are in contact with the analyzed solution - an indicator electrode, the potential of which depends on the concentration of the substance, and an electrode with a constant potential - a reference electrode, against which the potential of the indicator electrode is measured. The potential difference is measured using special devices - potentiometers.
In methods with the imposition of extraneous potential, electrochemical cell, so named because at the electrodes of the cell, under the influence of an applied potential, electrolysis occurs - the oxidation or reduction of a substance. In conductometric analysis, a conductometric cell is used in which the electrical conductivity of a solution is measured. According to the method of application, electrochemical methods can be classified into direct ones, in which the concentration of substances is measured according to the readings of the device, and electrochemical titration, where the indication of the equivalence point is recorded using electrochemical measurements. In accordance with this classification, potentiometry and potentiometric titration, conductometry and conductometric titration, etc. are distinguished.
Instruments for electrochemical determinations, in addition to the electrochemical cell, stirrer, and load resistance, include devices for measuring potential difference, current, solution resistance, and amount of electricity. These measurements can be carried out with pointer instruments (voltmeter or microammeter), oscilloscopes, and automatic recording potentiometers. If the electrical signal from the cell is very weak, then it is amplified using radio amplifiers. In devices of methods with the imposition of extraneous potential, an important part is the device for supplying the cell with the appropriate potential of stabilized direct or alternating current (depending on the type of method). The power supply unit for electrochemical analysis devices usually includes a rectifier and a voltage stabilizer, which ensures constant operation of the device.
1.2 Potentiometry
Potentiometry is based on measuring the difference in electrical potentials that arises between dissimilar electrodes immersed in a solution with the substance being determined. Electric potential arises at the electrodes when a redox (electrochemical) reaction occurs on them. Redox reactions occur between an oxidizing agent and a reducing agent with the formation of redox pairs, the potential E of which is determined by the Nernst equation by the concentrations of the pair components [ok] and [rec]:
Where E°- standard electrode potential, V;
n- the number of electrons participating in the process.
Potentiometric measurements are carried out by lowering two electrodes into the solution - an indicator electrode, which reacts to the concentration of the ions being determined, and a standard or reference electrode, against which the potential of the indicator is measured. Several types of indicator and standard electrodes are used.
Electrodes of the first kind reversible with respect to the metal ions of which the electrode consists. When such an electrode is lowered into a solution containing metal cations, an electrode pair is formed: M n + /M.
Electrodes of the second kind sensitive to anions and are metal M coated with a layer of its insoluble salt MA with an anion A- to which the electrode is sensitive. When such an electrode comes into contact with a solution containing the specified anion A-, potential E arises, the value of which depends on the product of salt solubility
ETC M.A. and anion concentration [ A-] in solution.
Electrodes of the second type are silver chloride and calomel. Saturated silver chloride and calomel electrodes maintain a constant potential and are used as reference electrodes against which the potential of the indicator electrode is measured.
Inert electrodes- a plate or wire made of difficult-to-oxidize metals - platinum, gold, palladium. They are used to measure E in solutions containing a redox couple (for example, Fe 3+ /Fe 2+).
Membrane electrodes different types have a membrane on which membrane potential E arises. The value of E depends on the difference in concentrations of the same ion on different sides of the membrane. The simplest and most commonly used membrane electrode is the glass electrode.
Mixing insoluble salts type AgBr, AgCl, AgI and others with some plastics (rubbers, polyethylene, polystyrene) led to the creation ion selective electrodes on Br-, Cl-, I-, selectively adsorbing the indicated ions from solution due to the Paneth - Faience - Hahn rule. Since the concentration of detectable ions outside the electrode differs from that inside the electrode, the equilibria on the membrane surfaces are different, which leads to the appearance of a membrane potential.
To carry out potentiometric determinations, an electrochemical cell is assembled from an indicator reference electrode, which is immersed in the solution being analyzed and connected to a potentiometer. The electrodes used in potentiometry have a high internal resistance (500-1000 MOhm), so there are types of potentiometers that are complex electronic high-resistance voltmeters. To measure the EMF of the electrode system in potentiometers, a compensation circuit is used to reduce the current in the cell circuit.
Most often, potentiometers are used for direct measurements of pH, indicators of the concentrations of other ions pNa, pK, pNH?, pCl and mV. Measurements are carried out using appropriate ion-selective electrodes.
To measure pH, a glass electrode and a reference electrode - silver chloride - are used. Before carrying out analyses, it is necessary to check the calibration of pH meters using standard buffer solutions, the fixation of which is attached to the device.
pH meters in addition to direct determinations pH, pNa, pK, pNH?, pCl and others allow potentiometric titration of the ion being determined.
1.3 Potentiometric titration
Potentiometric titration is carried out in cases where chemical indicators cannot be used or when a suitable indicator is not available.
In potentiometric titration, potentiometer electrodes placed in the titrated solution are used as indicators. In this case, electrodes are used that are sensitive to titrated ions. During the titration process, the ion concentration changes, which is recorded on the measuring scale of the potentiometer. Having recorded the potentiometer readings in pH or mV units, plot their dependence on the titrant volume (titration curve), determine the equivalence point and the volume of titrant consumed for titration. Based on the data obtained, a potentiometric titration curve is constructed.
The potentiometric titration curve has a form similar to the titration curve in titrimetric analysis. The titration curve is used to determine the equivalence point, which is located in the middle of the titration jump. To do this, tangents are drawn to sections of the titration curve and the equivalence point is determined in the middle of the tangent of the titration jump. Largest change value ? pH/?V acquires at the point of equivalence.
The equivalence point can be determined even more accurately by Gran’s method, which is used to construct the dependence ? V/?E from the titrant volume. Using the Gran method, potentiometric titration can be carried out without bringing it to the equivalence point.
Potentiometric titration is used in all cases of titrimetric analysis.
Acid-base titration uses a glass electrode and a reference electrode. Since the glass electrode is sensitive to changes in the pH of the medium, when they are titrated, changes in the pH of the medium are recorded on the potentiometer. Acid-base potentiometric titration is successfully used in the titration of weak acids and bases (pK?8). When titrating mixtures of acids, it is necessary that their pK differ by more than 4 units, otherwise part of the weaker acid is titrated together with the strong one, and the titration jump is not clearly expressed.
This allows the use of potentiometry to construct experimental titration curves, select indicators for titration and determine acidity and basicity constants.
In precipitation potentiometric titration, an electrode made of a metal that forms an electrode pair with the ions being determined is used as an indicator.
When complexometric titration is used: a) a metal electrode reversible to the ion of the metal being determined; b) a platinum electrode in the presence of a redox couple in the solution. When one of the components of the redox couple is bound by the titrant, its concentration changes, which causes changes in the potential of the indicator platinum electrode. Back titration of an excess EDTA solution added to a metal salt with a solution of an iron (III) salt is also used.
For redox titration, a reference electrode and a platinum indicator electrode, sensitive to redox couples, are used.
Potentiometric titration is one of the most used methods of instrumental analysis due to its simplicity, accessibility, selectivity and wide capabilities.
1.4 Conductometry. Conductometric titration
Conductometry is based on measuring the electrical conductivity of a solution. If two electrodes are placed in a solution of a substance and a potential difference is applied to the electrodes, an electric current will flow through the solution. Like every conductor of electricity, solutions are characterized by resistance R and its inverse quantity - electrical conductivity L:
Where R- resistance, Ohm;
Specific resistance, Ohm. cm;
S - surface area, cm 2.
Where L - electrical conductivity, Ohm-1;
R- resistance, Ohm.
Conductometric analysis is carried out using conductometers - devices that measure the resistance of solutions. By resistance value R determine the electrical conductivity of solutions that is its inverse value L.
The concentration of solutions is determined by direct conductometry and conductometric titration. Direct conductometry used to determine the concentration of a solution using a calibration graph. To create a calibration graph, the electrical conductivity of a series of solutions with a known concentration is measured and a calibration graph of the electrical conductivity versus concentration is constructed. Then the electrical conductivity of the analyzed solution is measured and its concentration is determined from the graph.
More often used conductometric titration. In this case, the analyzed solution is placed in a cell with electrodes, the cell is placed on a magnetic stirrer and titrated with the appropriate titrant. Titrant is added in equal portions. After adding each portion of titrant, measure the electrical conductivity of the solution and plot the relationship between electrical conductivity and titrant volume. When a titrant is added, a change in the electrical conductivity of the solution occurs. the titration curve inflects.
From n the mobility of ions depends on the electric conductivity of the solution: the higher the mobility b ions, the greater the electrical conductivity of the solution.
Conductometric titration has several advantages. It can be carried out in turbid and colored environments, in the absence of chemical indicators. The method has increased sensitivity and allows you to analyze dilute solutions of substances (up to 10-4 mol/dmі). Mixtures of substances are analyzed by conductometric titration, because the differences in the mobility of the various ions are significant and can be titrated differentially in the presence of each other.
Conductometric analysis can be easily automated if the titrant solution is supplied from a burette at a constant speed, and the change in the electrical conductivity of the solution is recorded on a recorder.
This type of conductometry is called chrono- conductometric analysis.
In acid-base titration, strong acids, weak acids, salts of weak bases and strong acids can be determined by conductometry.
IN precipitative conductometrictitration the electrical conductivity of the titrated solutions first decreases or remains at a certain constant level due to the binding of the titrated electrolyte into a precipitate, after i.e. when an excess of titrant appears, it increases again.
IN complexmetric conductometric titration changes in the electrical conductivity of the solution occur due to the binding of metal cations into a complex with EDTA.
Redox conductometrictitro- tion based on a change in the concentration of reacting ions and the appearance of new ions in the solution, which changes the electrical conductivity of the solution.
In recent years there has been development high frequency conductometry, in which the electrodes do not contact the solution, which is important when analyzing aggressive media and solutions in closed vessels.
Two options have been developed - straighthigh-frequency conductometry and high-frequency titration.
Direct high-frequency conductometry is used to determine the moisture content of substances, grain, wood, the concentration of solutions in closed vessels - ampoules, and when analyzing aggressive liquids.
High-frequency titration is carried out on special titrators - TV-6, TV-6L.
High-frequency conductometric titrations are carried out as acid-base, redox or precipitation titrations in cases where a suitable indicator is not available or when analyzing mixtures of substances.
1.5 Coulometry. Coulometric titration
In coulometry, substances are determined by measuring the amount of electricity spent on their quantitative electrochemical transformation. Coulometric analysis is carried out in an electrolytic cell into which a solution of the substance being determined is placed. When an appropriate potential is applied to the electrodes of the cell, electrochemical reduction or oxidation of the substance occurs. According to the laws of electrolysis, discovered by Faraday, the amount of substance reacted at the electrode is proportional to the amount of electricity passing through the solution:
Where g- mass of released substance, g;
n- the number of electrons transferred in the electrode process;
F- Faraday number (F = 96485 C/mol);
I- current strength, A;
t- time, s;
M- molar mass of the released substance, g/mol.
Coulometric analysis makes it possible to determine substances that do not deposit on electrodes or escape into the atmosphere during an electrochemical reaction.
There are direct coulometry and coulometric titration.. The high accuracy and sensitivity of methods for measuring electric current provides coulometric analysis with a unique accuracy of 0.1-0.001%, and sensitivity up to 1 10 -8? 1 10 -10 g. Therefore, coulometric analysis is used to determine microimpurities and destruction products of substances, which is important when monitoring their quality.
To indicate i.e. When coulometric titration, chemical and instrumental methods can be used - adding indicators, detecting colored compounds photometrically or spectrophotometrically.
Unlike other methods of analysis, coulometry can be fully automated, which minimizes random determination errors. This feature was used to create automatic coulometric titrators - sensitive instruments used for particularly accurate analyzes when other methods are not sensitive enough. When analyzing substances that are poorly soluble in water, coulometry can be carried out on electrodes made of acetylene black, which are a good adsorbent and remove such substances from the reaction medium with sufficient completeness. Coulometric titration is a promising method of instrumental analysis. It can find wide application for solving a number of special analytical problems - analysis of impurities, small quantities of drugs, determination of toxic substances, trace elements and other compounds in biological material and the environment.
CONCLUSION
The work provides a review of the main electrochemical research methods, describing in detail their principle, application, advantages and disadvantages.
Electrochemical methods of analysis are a group of methods of quantitative chemical analysis based on the use of electrolysis.
Varieties of the method are electrogravimetric analysis (electroanalysis), internal electrolysis, contact exchange of metals (cementation), polarographic analysis, coulometry, etc. In particular, electrogravimetric analysis is based on weighing the substance released on one of the electrodes. The method allows not only to carry out quantitative determinations of copper, nickel, lead, etc., but also to separate mixtures of substances.
In addition, electrochemical methods of analysis include methods based on measuring electrical conductivity (conductometry) or electrode potential (potentiometry). Some electrochemical methods are used to find the end point of a titration (amperometric titration, conductometric titration, potentiometric titration, coulometric titration).
LIST OF REFERENCES USED
1. Fundamentals of modern electrochemical analysis. Budnikov G.K., Maistrenko V.N., Vyaselev M.R., M., Mir, 2003.
2. J. Plambeck, ed. S. G. Mayranovsky Electrochemical methods of analysis. Fundamentals of theory and application: trans. from English / Vidannya: Mir, 1985.
3. Damaskin B.B., Petriy O.A., Tsirlina G.A. Electrochemistry - M.: chemistry, 2001. 624 p.
4. STO 005-2015. Quality Management System. Educational and methodological activities. Registration of course projects (works) and final qualifying works of technical specialties.
Posted on Allbest.ru
...Similar documents
Classification of electrochemical methods of analysis, the essence of voltammetry, conductometry, potentiometry, amperometry, coulometry, their application in environmental protection. Characteristics of chemical analytical equipment and main selling companies.
course work, added 01/08/2010
Electrochemical methods are based on measuring the electrical parameters of electrochemical phenomena occurring in the solution under study. Classification of electrochemical methods of analysis. Potentiometric, conductometric, coulometric titration.
abstract, added 01/07/2011
Classification of electrochemical methods of analysis. Potentiometric determination of the concentration of a substance in a solution. The principle of conductometry. Types of reactions during conductometric titration. Quantitative polarographic analysis. Direct coulometry.
course work, added 04/04/2013
The essence of electroanalytical methods, the ability to obtain experimental information about the kinetics and thermodynamics of chemical systems. Advantages, disadvantages and suitability of voltammetry, conductometry, potentiometry, amperometry and coulometry.
abstract, added 11/20/2009
General characteristics of potentiometric analysis. Indicator electrodes (electron exchange and ion selective). Types of potentiometric method of analysis. Direct potentiometry and potentiometric titration. Measurement of EMF of electrochemical circuits.
course work, added 06/08/2012
General concepts, conditions and classification of electrochemical methods of analysis. Potentiometric analysis (potentiometry). Amperometric titration (potentiometric polarization titration). Quantitative polarographic analysis.
abstract, added 10/01/2012
Electrochemical research methods, their classification and essence, history of occurrence. Determination of acid concentration by conductometric titration; potentials of electrodes, EMF of a galvanic cell, electrochemical equivalent of copper.
course work, added 12/15/2014
Study of the method of potentiometric analysis. Analysis and evaluation of research objects. Study of the technique of potentiometric analysis as applied to this object. Determining the possibility of using methods for potentiometric analysis of meat products.
course work, added 09/16/2017
Basic electrochemical methods of analysis. General characteristics of potentiometric analysis. Types of potentiometric method of analysis. The use of a galvanic cell consisting of two electrodes. The procedure for measuring the potential of the indicator electrode.
course work, added 08/11/2014
Classification of instrumental methods of analysis according to the parameter being determined and the method of measurement. The essence of potentiometric, amperometric, chromatographic and photometric titration. Qualitative and quantitative determination of zinc chloride.
Electrochemical methods of analysis are a set of methods of qualitative and quantitative analysis based on electrochemical phenomena occurring in the medium under study or at the interface and associated with changes in the structure, chemical composition or concentration of the analyte.
Electrochemical methods of analysis (ECMA) are based on processes occurring on electrodes or the interelectrode space. Their advantage is high accuracy and comparative simplicity of both equipment and analysis methods. High accuracy is determined by very precise patterns used in ECMA. A great convenience is that this method uses electrical influences, and the fact that the result of this influence (response) is also obtained in the form of an electrical signal. This ensures high speed and accuracy of reading, and opens up wide possibilities for automation. ECMA are distinguished by good sensitivity and selectivity; in some cases they can be classified as microanalysis, since sometimes less than 1 ml of solution is sufficient for analysis.
According to the types of analytical signal, they are divided into:
1) conductometry - measurement of the electrical conductivity of the test solution;
2) potentiometry - measurement of the current-free equilibrium potential of the indicator electrode, for which the test substance is potentiodetermining;
3) coulometry - measurement of the amount of electricity required for complete transformation (oxidation or reduction) of the substance under study;
4) voltammetry - measurement of stationary or non-stationary polarization characteristics of electrodes in reactions involving the test substance;
5) electrogravimetry - measurement of the mass of a substance released from a solution during electrolysis.
27. Potentiometric method.
potentiometry - measurement of the current-free equilibrium potential of the indicator electrode, for which the test substance is potentiation-determining.
A) standard (reference electrode) - has a constant potential, independent of external influences. Terms
B) individual electrode - its potential depends on the concentration of the substance.
Potential depends on concentration: E = f(c)
Nerist equation E= E° + lna kat
E° - standard. Electron. Potential (const)
R- Univer. Gas constantconst)
T – absolute temp (t)- +273 °
.п – number of electrons involved. In oxidation/reduction Reactions
. a – active concentration
Potentiometry method
Ionometry potentiometry (small solution is added to the research solution. Standard solution (titran) is added in portions, after each addition the potential is measured. - E)
Equivalence point
EСх Vх = l t *Vt
28. Conductometric method.
conductometry - measurement of the electrical conductivity of the test solution.
Conductometric titration
Conductometer (device)
Conductometric analysis (conductometry) is based on the use of the relationship between the electrical conductivity (electrical conductivity) of electrolyte solutions and their concentration.
The electrical conductivity of electrolyte solutions - conductors of the second type - is judged on the basis of measuring their electrical resistance in an electrochemical cell, which is a glass vessel (glass) with two electrodes soldered into it, between which the test electrolyte solution is located. An alternating electric current is passed through the cell. Electrodes are most often made of metal platinum, which, to increase the surface of the electrodes, is coated with a layer of spongy platinum by electrochemical deposition of platinum compounds from solutions (platinized platinum electrodes).
29.Polarography.
Polarography is a method of qualitative and quantitative chemical analysis based on obtaining curves of current versus voltage in a circuit consisting of the solution under study and electrodes immersed in it, one of which is highly polarizable and the other practically non-polarizable. Such curves - polarograms - are obtained using polarographs.
The polarographic method is characterized by high sensitivity. To perform the analysis, 3-5 ml of the test solution is usually sufficient. Analysis using an auto-recording polarograph lasts only about 10 minutes. Polarography is used to determine the content of toxic substances in objects of biological origin (for example, compounds of mercury, lead, thallium, etc.), to determine the degree of oxygen saturation of the blood, to study the composition of exhaled air, and harmful substances in the air of industrial enterprises. The polarographic method of analysis is highly sensitive and makes it possible to determine substances at very low (up to 0.0001%) concentrations in solution.
30. Classification of spectral analysis methods. The concept of spectrum.
Spectral analysis is a set of methods for determining quality and quantity. Composition, as well as structure of matter (based on the interaction of the research object with various types of radiation.)
All spectroscopic methods are based on the interaction of atoms, molecules or ions that make up the substance being analyzed with electromagnetic radiation. This interaction manifests itself in the absorption or emission of photons (quanta). Depending on the nature of the sample’s interaction with electromagnetic radiation, two groups of methods are distinguished:
Emission and absorption. Depending on which particles form the analytical signal, a distinction is made between atomic spectroscopy methods and molecular spectroscopy methods
Emission
In emission methods, the analyzed sample emits photons as a result of its excitation.
absorption
In absorption methods, radiation from an external source is passed through the sample, and some of the quanta are selectively absorbed by atoms or molecules
Range- distribution of values of a physical quantity (usually energy, frequency or mass). A graphical representation of such a distribution is called a spectral diagram. Typically, spectrum refers to the electromagnetic spectrum - the spectrum of frequencies (or the same thing as quantum energies) of electromagnetic radiation.
1.light reflection
2.rotation of the light beam (defraction)
3.light scattering: nephelometry, turbidimetry
4.light absorption
5re-emission
A) phosphorescence (lasts a long time)
B) fluorescence (very short)
According to the nature of the distribution of physical quantity values, spectra can be discrete (line), continuous (solid), and also represent a combination (superposition) of discrete and continuous spectra.
Examples of line spectra include mass spectra and spectra of bonded-bonded electronic transitions of an atom; examples of continuous spectra are the spectrum of electromagnetic radiation of a heated solid and the spectrum of free-free electronic transitions of an atom; examples of combined spectra are the emission spectra of stars, where chromospheric absorption lines or most sound spectra are superimposed on the continuous spectrum of the photosphere.
31. Photometry: principle of the method, application in forensic research.
Photometry - a spectral method based on the absorption of electromagnetic radiation in the visible and near ultraviolet range (the method is based on the absorption of light)
Molecular Atomic
Spectroscopy spectroscopy (In electron analysis)
Cuvette - light is passed through it
l
I (output light intensity)
I° is the intensity of the incident light.
Photometry is a section of physical optics and measurement technology devoted to methods for studying the energy characteristics of optical radiation in the process of its emission, propagation in various media and interaction with bodies. Photometry is carried out in the ranges of infrared (wavelengths - 10 -3 ... 7 10 -7 m), visible (7 10 -7 ... 4 10 -7 m) and ultraviolet (4 10 -7 ... 10 -8 m) optical radiation. When electromagnetic radiation of the optical range propagates in a biological environment, a number of main effects are observed: absorption and scattering of radiation by atoms and molecules of the medium, scattering of inhomogeneities of the medium by particles, depolarization of radiation. By recording data on the interaction of optical radiation with the medium, it is possible to determine quantitative parameters associated with the medical and biological characteristics of the object under study. To measure photometric quantities, instruments called photometers are used. In photometric terms, light is radiation capable of producing a sensation of brightness when exposed to the human eye. The basis of photometry as a science is the light field theory developed by A. Gershun.
There are two general methods of photometry: 1) visual photometry, which uses the ability of the human eye to perceive differences in brightness by equalizing the brightness of two comparison fields by mechanical or optical means; 2) physical photometry, in which various light receivers of a different kind are used to compare two light sources - vacuum photocells, semiconductor photodiodes, etc.
32. Bouguer-Lambert-Beer law, its use in quantitative analysis.
A physical law that determines the attenuation of a parallel monochromatic beam of light as it propagates in an absorbing medium.
The law is expressed by the following formula:
![]() ,
,

where is the intensity of the incoming beam, is the thickness of the layer of substance through which the light passes, is the absorption index (not to be confused with the dimensionless absorption index, which is related to the formula, where is the wavelength).
The absorption index characterizes the properties of a substance and depends on the wavelength λ of the absorbed light. This dependence is called the absorption spectrum of the substance.
For solutions of absorbing substances in non-light-absorbing solvents, the absorption index can be written as
where is the coefficient characterizing the interaction of a molecule of an absorbing solute with light with wavelength λ, is the concentration of the solute, mol/l.
The statement that does not depend on is called Beer's law (not to be confused with Beer's law). This law assumes that the ability of a molecule to absorb light is not affected by other surrounding molecules of the same substance in solution. However, numerous deviations from this law are observed, especially at large .
If a light flux of intensity I passes through a certain layer of a solution or gas of thickness I, then according to the Lambert-Beer law, the amount of absorbed light will be proportional to the intensity /, the concentration c of the substance absorbing light, and the thickness of the LAYER) the BMB law, which relates the intensity of light incident on the substance and the substance that passed through it, with the concentration of the substance and the thickness of the absorbing layer. Well, this is the same as refraction, only attenuation in the substance. Which absorbs light at a certain percentage. That is, the remainder of the light output is
33.IR spectroscopy.
This analysis method is based on recording the infrared absorption spectra of a substance. Absorption by matter in the infrared region occurs due to vibrations of atoms in molecules. Vibrations are divided into stretching (when the distances between atoms change during the vibration) and vibrational (when the angles between the bonds change during the vibration). Transitions between different vibrational states in molecules are quantized, due to which absorption in the IR region has the form of a spectrum, where each vibration has its own wavelength. It is clear that the wavelength for each vibration depends on which atoms participate in it, and in addition, it depends little on their environment.
The IR spectroscopy method is not a separating method, that is, when studying any substance, it may turn out that what was actually studied was a mixture of several substances, which of course will greatly distort the results of deciphering the spectrum. Well, it’s not entirely correct to talk about the unambiguous identification of a substance using the IR spectroscopy method, since the method rather allows one to identify certain functional groups, rather than their quantity in a compound and their method of communication with each other.
The IR spectroscopy method is used to conduct research on polymer materials, fibers, paint coatings, and narcotic drugs (when identifying the filler, carbohydrates, including polysaccharides, are often used). The method is especially indispensable in the study of lubricants, as it makes it possible to simultaneously determine the nature of both the lubricant base and possible additives (additives) to this base.
34. X-ray fluorescence analysis.
(XRF) is one of the modern spectroscopic methods for studying a substance in order to obtain its elemental composition, that is, its elemental analysis. It can be used to analyze various elements from beryllium (Be) to uranium (U). The XRF method is based on the collection and subsequent analysis of a spectrum obtained by exposing the material under study to X-ray radiation. When irradiated, the atom goes into an excited state, which consists in the transition of electrons to higher energy levels. The atom remains in an excited state for an extremely short time, on the order of one microsecond, after which it returns to a quiet position (ground state). In this case, electrons from the outer shells either fill the resulting vacancies, and the excess energy is emitted in the form of a photon, or the energy is transferred to another electron from the outer shells (Auger electron)
Ecology and environmental protection: determination of heavy metals in soils, sediments, water, aerosols, etc.
Geology and mineralogy: qualitative and quantitative analysis of soils, minerals, rocks, etc.
Metallurgy and chemical industry: quality control of raw materials, production process and finished products
Paint and varnish industry: analysis of lead paints
35. Atomic emission spectroscopy.
Atomic emission spectral analysis is a set of elemental analysis methods based on the study of the emission spectra of free atoms and ions in the gas phase. Typically, emission spectra are recorded in the most convenient optical wavelength range from 200 to 1000 nm.
AES (atomic emission spectrometry) is a method of determining the elemental composition of a substance from the optical emission spectra of atoms and ions of the analyzed sample, excited in light sources. As light sources for atomic emission analysis, a burner flame or various types of plasma are used, including electric spark or arc plasma, laser spark plasma, inductively coupled plasma, glow discharge, etc. AES is the most common express, highly sensitive method for identifying and quantifying elements impurities in gaseous, liquid and solid substances, including high-purity ones.
Areas of use:
Metallurgy: analysis of the composition of metals and alloys,
Mining industry: study of geological samples and mineral raw materials,
Ecology: water and soil analysis,
Equipment: analysis of motor oils and other technical fluids for metal impurities,
Biological and medical research.
Operating principle.
The operating principle of an atomic emission spectrometer is quite simple. It is based on the fact that the atoms of each element can emit light of certain wavelengths - spectral lines, and these wavelengths are different for different elements. In order for atoms to start emitting light, they must be excited - by heat, electrical discharge, laser or some other means. The more atoms of a given element are present in the analyzed sample, the brighter the radiation of the corresponding wavelength will be.
The intensity of the spectral line of the analyzed element, in addition to the concentration of the analyzed element, depends on a large number of different factors. For this reason, it is impossible to theoretically calculate the relationship between line intensity and the concentration of the corresponding element. That is why standard samples that are similar in composition to the sample being analyzed are required for analysis. These standard samples are first exposed (burned) on the device. Based on the results of these burns, a calibration graph is constructed for each analyzed element, i.e. dependence of the intensity of the spectral line of an element on its concentration. Subsequently, when analyzing samples, these calibration graphs are used to recalculate the measured intensities into concentrations.
Preparation of samples for analysis.
It should be borne in mind that in reality several milligrams of a sample from its surface are analyzed. Therefore, to obtain correct results, the sample must be homogeneous in composition and structure, and the composition of the sample must be identical to the composition of the metal being analyzed. When analyzing metal in a foundry or smelter, it is recommended to use special molds for casting samples. In this case, the sample shape can be arbitrary. It is only necessary that the sample being analyzed has sufficient surface area and can be clamped in a stand. Special adapters can be used to analyze small samples such as rods or wires.
Advantages of the method:
Non-contact,
Possibility of simultaneous quantitative determination of a large number of elements,
High accuracy,
Low detection limits,
Ease of sample preparation,
Low cost.
36. Atomic absorption spectroscopy.
a method for quantitatively determining the elemental composition of a substance under study using atomic absorption spectra, based on the ability of atoms to selectively absorb electromagnetic radiation in decomp. parts of the spectrum. A.-a.a. carried out on special devices - absorption spectrophotometers. A sample of the analyzed material is dissolved (usually with the formation of salts); the solution in the form of an aerosol is fed into the burner flame. Under the influence of a flame (3000°C), salt molecules dissociate into atoms, which can absorb light. Then a beam of light is passed through the burner flame, in the spectrum of which there are spectral lines corresponding to one or another element. The spectral lines under study are isolated from the total radiation using a monochromator, and their intensity is recorded by a recording unit. Math. processing is carried out according to the formula: J = J0 * e-kvI,
where J and J0 are the intensities of transmitted and incident light; kv – coefficient absorption, depending on its frequency; I - thickness of the absorbing layer
more sensitive than nuclear power plants
37. Nephelometry and turbidimetry.
S = log (I°/I) intensity falling. In solution (I°) divide by the intensity leaving solution (I) =
k-const turbidity
b – light beam path length
N is the number of particles per unit. solution
Nephelometric and turbidimetric analysis uses the phenomenon of light scattering by solid particles suspended in solution.
Nephelometry is a method for determining the dispersion and concentration of colloidal systems by the intensity of the light scattered by them. Nephelometry, measurements are made in a special device, a nephelometer, the action of which is based on comparing the intensity of light scattered by the medium under study with the intensity of light scattered by another medium, which serves as a standard. The theory of light scattering by colloidal systems in which particle sizes do not exceed the half-wavelength of incident light was developed by the English physicist J. Rayleigh in 1871. According to Rayleigh's law, the intensity of light I scattered in a direction perpendicular to the incident beam is expressed by the formula I = QNvlk - where q is the intensity of the incident light, N is the total number of particles per unit volume, or partial concentration, v is the volume of one particle, \ is the wavelength of the incident light, k is a constant depending on the refractive indices of colloidal particles and the dispersion medium surrounding them, distance from the light source, as well as from the accepted units of measurement
Turbidimetry is a method for analyzing turbid media based on measuring the intensity of light absorbed by them. Turbidimetric measurements are carried out in transmitted light using visual turbidimeters or photoelectric colorimeters. The measurement technique is similar to the colorimetric one and is based on the applicability of the Bouguer-Lambert law to turbid media, which in the case of suspensions is valid only for very thin layers or at significant dilutions. Turbidimetry requires careful observance of the conditions for the formation of the dispersed phase, similar to the conditions observed for nephelometry. A significant improvement in turbidimetry is the use of turbidimetric peak turbidity titration using photoelectric colorimeters. Turbidimetry is successfully used for the analytical determination of sulfates, phosphates, chlorides, cyanides, lead, zinc, etc.
The main advantage of nephelometric and turbidimetric methods is their high sensitivity, which is especially valuable in relation to elements or ions for which there are no color reactions. In practice, for example, nephelometric determination of chloride and sulfate in natural waters and similar objects is widely used. In terms of accuracy, turbidimetry and nephelometry are inferior to photometric methods, which is mainly due to the difficulties of obtaining suspensions with the same particle sizes, stability over time, etc. In addition to the usual relatively small errors in photometric determination, errors associated with the insufficient reproducibility of chemical analytical methods are added properties of suspensions.
Nephelometry and turbidimetry are used, for example, to determine SO4 in the form of a suspension of BaSO4, Cl- in the form of a suspension of AgCl, S2- in the form of a suspension of CuS from the bottom. the limits of detectable contents are ~ 0.1 μg/ml. To standardize the conditions of analysis in experiments, it is necessary to strictly control the temperature, the volume of suspension, the concentration of reagents, the stirring speed, and the time of measurements. Precipitation must proceed quickly, and the precipitated particles must be small in size and have low pH. To prevent coagulation of large particles, a stabilizer is often added to the solution, for example. gelatin, glycerin.
38. Chromatography: history of origin, principle of the method, application in court. Research.
Chromatography is a dynamic sorption method for separating and analyzing mixtures of substances, as well as studying the physicochemical properties of substances. It is based on the distribution of substances between two phases - stationary (solid phase or liquid bound on an inert carrier) and mobile (gas or liquid phase, eluent). The name of the method is associated with the first experiments in chromatography, during which the developer of the method, Mikhail Tsvet, separated brightly colored plant pigments.
The chromatography method was first used by the Russian botanist Mikhail Semenovich Tsvet in 1900. He used a column filled with calcium carbonate to separate plant pigments. The first report on the development of the chromatography method was made by Tsvet on December 30, 1901 at XI Congress of Naturalists and Doctors in St. Petersburg. The first printed work on chromatography was published in 1903, in the journal Proceedings of the Warsaw Society of Naturalists. First time term chromatography appeared in two printed works by Color in 1906, published in a German magazine Berichte der Deutschen Botanischen Gesellschaft. In 1907, Tsvet demonstrates his method German Botanical Society.
In 1910-1930, the method was undeservedly forgotten and practically did not develop.
In 1931, R. Kuhn, A. Winterstein and E. Lederer, using chromatography, isolated α and β fractions in crystalline form from crude carotene, thereby demonstrating the preparative value of the method.
In 1941, A. J. P. Martin and R. L. M. Singh developed a new type of chromatography, which was based on the difference in the distribution coefficients of the separated substances between two immiscible liquids. The method was called " partition chromatography».
In 1947, T. B. Gapon, E. N. Gapon and F. M. Shemyakin developed the method of “ion exchange chromatography”.
In 1952, J. Martin and R. Singh were awarded the Nobel Prize in Chemistry for the creation of the method of partition chromatography.
From the mid-20th century to the present day, chromatography has developed intensively and has become one of the most widely used analytical methods.
Classification: Gas, Liquid
Fundamentals of chromatography process. To carry out chromatographic separation of substances or determination of their physical-chemical. characteristics are usually used special. devices - chromatographs. Basic chromatograph units - chromatographic. column, detector, and sample injection device. The column containing the sorbent performs the function of separating the analyzed mixture into its constituent components, and the detector performs the function of separating their quantities. definitions. The detector located at the outlet of the column automatically continuously determines the concentration of the separated compounds. in the flow of the mobile phase After introducing the analyzed mixture with the flow of the mobile phase into the column, the zones of all substances are located at the beginning of the chromatographic. columns (Fig. 1). Under the influence of the flow of the mobile phase, the components of the mixture begin to move along the column with decomposition. speeds, the values of which are inversely proportional to the distribution coefficients K of the chromatographed components. Well-sorbed substances, the distribution constant values for which are large, move along the sorbent layer along the column more slowly than poorly sorbed substances. Therefore, component A leaves the column the fastest, then component B, and the last one to leave the column is component C (K A<К Б <К В). Сигнал детектора, величина к-рого пропорциональна концентрации определяемого в-ва в потоке элюента, автоматически непрерывно записывается и регистрируется (напр., на диаграммной ленте). Полученная хроматограмма отражает расположение хроматографич. зон на слое сорбента или в потоке подвижной фазы во времени.

Rice. 1. Separation of a mixture of three components (A, B and C) on a chromatographic column K with detector D: a - position of the chromatographic zones of the separated components in the column at certain time intervals; b - chromatogram (C - signal, t - time) .
With flat layer chromatography When separating, a sheet of paper or a plate with a layer of sorbent with applied samples of the substance under study is placed in a chromatography. camera. After separation, the components are determined by any suitable method.
39. Classification of chromatographic methods.
Chromatography is a method of separation and analysis of substances based on the distribution of the analyte. The difference between 2 phases: mobile and stationary
A solution of a mixture of substances to be separated is passed through a glass tube (Adsorption column) filled with an adsorbent. As a result, the components of the mixture are retained at different heights of the adsorbent column in the form of separate zones (layers). The stuff is better than adsorbir. They are at the top of the column, and worse adsorbed at the bottom of the column. Substances that cannot be adsorbed pass through the column without stopping and are collected in the filter.
Classifications:
1. According to the state of aggregation of the phases.
1) Movable
A) gas (inert gases: helium, argon, azone)
B) liquid
2. according to the method of implementation
1) on a plane (planar); thin-layer paper
2) columnar
A) packed (packed column filled with sorbent)
B) capillary (thin glass/quartz capillary on the inner surface of which a stationary phase is applied)
You can def. Items in small quantities.
The volatile substances are separated.
40. Chromatogram. Basic parameters of the chromatograph peak.
A chromatogram is the result of recording the dependence of the concentration of components at the outlet of the column on time.
H S
Each peak in the chromatogram is characterized by two main parameters
1. Retention time ( t R) is the time from the moment the analyzed sample is introduced until the maximum of the chromatographic peak is recorded. It depends on the nature of the substance and is a qualitative characteristic.
2. Height ( h) or area ( S) peak
S = ½ ω × h. (4)
The height and area of the peak depend on the amount of substance and are quantitative characteristics.
The retention time consists of two components - the residence time of substances in the mobile phase ( t m) and residence time in the stationary phase ( t s):
Identification of peaks of unknown components of the analyzed mixture is carried out by comparison (comparison). values determined directly from the chromatogram, with corresponding tabulated data for known compounds. When identifying in chromatography, only negative is reliable. answer; for example, peak i is not item A if the retention times of peak i and item A do not coincide. The coincidence of the retention times of peak i and substance A is a necessary but not sufficient condition for concluding that peak i is substance A.
In practical work, the choice of one or another parameter for the quantitative interpretation of chromatograms is determined by the combined influence of several factors: the speed and ease of calculation, the shape (wide, narrow) and degree of asymmetry of the chromatographic peak, the efficiency of the column used, the completeness of separation of the components of the mixture, the presence of the necessary automated devices (integrators, computer systems for processing chromatographic data).
The determined parameter of the chromatographic peak is measured manually by the operator on the chromatogram at the end of the cycle of separation of the components of the analyzed mixture
The determined parameter of the chromatographic peak is measured automatically using digital voltmeters, integrators or specialized computers simultaneously with the separation of the components of the analyzed mixture in the column and recording of the chromatogram
Since the technique of decoding chromatograms comes down to measuring the parameters of the chromatographic peaks of the compound of interest and the standard compound, the chromatography conditions should ensure their complete separation as possible; all other components of the original sample under the accepted analysis conditions may not be separated from each other or even not appear at all on the chromatogram (this is advantage of the internal standard method over the internal normalization method)
41.Qualitative chromatographic analysis.
With a sufficient column length, complete separation of the components of any mixture can be achieved. And after eluting the separated components into separate fractions (eluates), determine the number of components of the mixture (it corresponds to the number of eluates), establish their qualitative composition, determine the amount of each of them, using appropriate methods of quantitative analysis.
Qualitative chromatographic analysis, i.e. identification of a substance according to its chromatogram can be performed by comparing chromatographic characteristics, most often the retained volume (i.e., the volume of the mobile phase passed through the column from the beginning of the mixture input until the appearance of this component at the outlet of the column), found under certain conditions for the components of the analyzed substance mixtures and for the standard.
42.Quantitative chromatograph analysis.
Quantitative chromatographic analysis is usually carried out on a chromatograph. The method is based on measuring various parameters of the chromatographic peak, depending on the concentration of the chromatographed substances - height, width, area and retained volume or the product of retained volume and peak height.
In quantitative gas chromatography, the methods of absolute calibration and internal normalization, or normalization, are used. The internal standard method is also used. With absolute calibration, the dependence of the peak height or area on the concentration of the substance is experimentally determined and calibration graphs are constructed or the corresponding coefficients are calculated. Next, the same characteristics of the peaks in the analyzed mixture are determined, and the concentration of the analyte is found from the calibration graph. This simple and accurate method is the main one for determining trace impurities.
When using the internal normalization method, the sum of any peak parameters, for example, the sum of the heights of all peaks or the sum of their areas, is taken as 100%. Then the ratio of the height of an individual peak to the sum of the heights or the ratio of the area of one peak to the sum of the areas when multiplied by 100 will characterize the mass fraction (%) of the component in the mixture. With this approach, it is necessary that the dependence of the value of the measured parameter on concentration is the same for all components of the mixture.
43.Planar chromatography. Use of thin layer chromatography for ink analysis.
The first form of use of cellulose in thin layer chromatography was paper chromatography. Available TLC and high-throughput TLC plates allow the separation of mixtures of polar substances, using at least ternary mixtures of water, an immiscible organic solvent, and a water-soluble solvent that promotes the formation of one phase as eluents)