The purpose of creating a business - opening a company, building a plant with the subsequent release of planned products - is to make a profit. But increasing personal income requires considerable costs, not only moral, but also financial. All monetary expenses aimed at producing any good are called costs in economics. To work without losses, you need to know the optimal volume of goods/services and the amount of money spent to produce them. To do this, average and marginal costs are calculated.
Average costs
With an increase in the volume of production, the costs that depend on it grow: raw materials, wages of key workers, electricity and others. They are called variables and have different dependencies for different quantities of goods/services produced. At the beginning of production, when the volumes of goods produced are small, variable costs are significant. As production increases, costs decrease due to economies of scale. However, there are expenses that an entrepreneur bears even with zero production of goods. Such costs are called fixed: utilities, rent, salaries of administrative staff.
Total costs are the sum of all costs for a specific volume of goods produced. But to understand the economic costs invested in the process of creating a unit of goods, it is customary to turn to average costs. That is, the quotient of total costs to output volume is equal to the value of average costs.
Marginal cost
Knowing the value of the funds spent on the sale of one unit of good, it cannot be argued that an increase in output by another 1 unit will be accompanied by an increase in total costs, in an amount equal to the value of average costs. For example, to produce 6 cupcakes, you need to invest 1200 rubles. It’s easy to immediately calculate that the cost of one cupcake should be at least 200 rubles. This value is equal to average costs. But this does not mean that preparing another pastry will cost 200 rubles more. Therefore, to determine the optimal volume of production, it is necessary to know how much money will be required to invest in order to increase output by one unit of the good.

Economists come to the aid of the firm’s marginal costs, which help them see the increase in total costs associated with the creation of an additional unit of goods/services.
Calculation
MC - this designation in economics has marginal costs. They are equal to the quotient of the increase in total expenses to the increase in volume. Since the increase in total costs in the short term is caused by an increase in average variable costs, the formula can look like: MC = ΔTC/Δvolume = Δaverage variable costs/Δvolume.
If the values of gross costs corresponding to each unit of production are known, then marginal costs are calculated as the difference between adjacent two values of total costs.
Relationship between marginal and average costs
Economic decisions on conducting business activities must be made after marginal analysis, which is based on marginal comparisons. That is, the comparison of alternative solutions and determination of their effectiveness occurs by assessing the incremental costs.
Average and marginal costs are interrelated, and changes in one relative to the other are the reason for adjusting the volume of output. For example, if marginal costs are less than average costs, then it makes sense to increase output. It is worth stopping the increase in production volume in the case when marginal costs are higher than average.
The equilibrium situation will be in which marginal costs are equal to the minimum value of average costs. That is, there is no point in further increasing production, since additional costs will increase.
Schedule
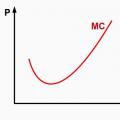
The presented graph shows the company's costs, where ATC, AFC, AVC are the average total, fixed and variable costs, respectively. The marginal cost curve is denoted MC. It has a convex shape towards the x-axis and at minimum points intersects the curves of average variables and total costs.

Based on the behavior of average fixed costs (AFC) on the graph, we can conclude that increasing the scale of production leads to their reduction; as mentioned earlier, there is an effect of economies of scale. The difference between ATC and AVC reflects the amount of fixed costs; it is constantly decreasing due to the approach of AFC to the x-axis.
Point P, characterizing a certain volume of product output, corresponds to the equilibrium state of the enterprise on the market. If you continue to increase volume, then costs will need to be covered by profits as they begin to increase sharply. Therefore, the company should settle on the volume at point P.
Marginal Revenue
One of the approaches to calculating production efficiency is to compare marginal costs with marginal revenue, which is equal to the increase in funds from each additional unit of goods sold. However, the expansion of production is not always associated with an increase in profits, because the dynamics of costs are not proportional to volume and with an increase in supply, demand and, accordingly, the price decrease.

A firm's marginal cost is equal to the price of the good minus marginal revenue (MR). If marginal cost is lower than marginal revenue, then production can be expanded, otherwise it must be curtailed. By comparing the values of marginal costs and income, for each value of output, it is possible to determine the points of minimum costs and maximum profit.
Profit maximization
How to determine the optimal production size to maximize profits? This can be done by comparing marginal revenue (MR) and marginal cost (MC).
Each new product produced adds marginal revenue to total income, but at the same time increases total costs by marginal cost. Any unit of output whose marginal revenue exceeds its marginal cost should be produced because the firm will receive more revenue from selling that unit than it will add to costs. Production is profitable as long as MR > MC, but as output increases, rising marginal costs due to the law of diminishing returns will make production unprofitable because they will begin to exceed marginal revenue.
Thus, if MR > MC, then production needs to be expanded if MR< МС, то его надо сокращать, а при MR = МС достигается равновесие фирмы (максимум прибыли).

Features when using the rule of equality of limit values:
- The condition MC = MR can be used to maximize profit in the case when the cost of the good is higher than the minimum value of average variable costs. If the price is lower, the company does not achieve its goal.
- Under conditions of pure competition, when neither buyers nor sellers can influence the formation of the cost of a good, marginal revenue is equivalent to the price of a unit of goods. This implies the equality: P = MC, in which marginal costs and marginal price are the same.
Graphical representation of a firm's equilibrium
Under pure competition, where price equals marginal revenue, the graph looks like this.

Marginal costs, the curve of which intersects the line parallel to the x-axis, characterizing the price of the good and marginal income, form a point showing the optimal sales volume.
In practice, there are times when doing business when an entrepreneur should think not about maximizing profits, but minimizing losses. This happens when the price of a good decreases. Stopping production is not the best option since fixed costs must be paid. If the price is less than the minimum value of gross average costs, but exceeds the value of the average variables, then the decision must be based on the output of goods in the volume obtained at the intersection of the marginal values (income and costs).
If the price of a product in a purely competitive market has fallen below the firm's variable costs, then management must take the responsible step of temporarily stopping the sale of goods until the cost of an identical good rises in the next period. This will trigger an increase in demand due to a decrease in supply. An example is agricultural firms that sell products in the autumn-winter period, and not immediately after harvest.
Costs in the long run
The time interval during which changes in the production capacity of an enterprise can occur is called the long-term period. The firm's strategy must include cost analysis for the future. In the long time frame, long-term average and marginal costs are also considered.

With the expansion of production capacity, there is a decrease in average costs and an increase in volumes up to a certain point, then costs per unit of output begin to increase. This phenomenon is called economies of scale.
The long-run marginal cost of an enterprise shows the change in all costs due to an increase in output. The average and marginal cost curves relate to each other over time in a similar way to the short-term period. The main strategy in the long run is the same - it is determining production volumes by means of the equality MC = MR.
The cost classification given in the previous section is only one of the possible ways to determine costs. It is also necessary to study the dependence of costs on the time factor and on the volume of output. There are three time periods: instantaneous, short-term and long-term. In the instantaneous period, all factors of production are stable, and all types of costs remain constant. In the short term, only some types of costs cannot change, but in the long term, all costs are variable.
In the short term, fixed, variable, and average and marginal costs are distinguished.
Fixed costs (FC) are costs that do not depend on the volume of products produced (from the English. fixed– fixed). These primarily include rental of buildings, equipment, depreciation charges, salaries of managers and management personnel.
Variable costs (V.C.) are costs, the value of which depends on the volume of products produced (from the English. variable– variable). These include the costs of raw materials, electricity, auxiliary materials, wages of workers and managers directly involved in production.
General costs(TS) is the sum of fixed and variable costs:
In Fig. 5.1 shows the company's costs in the short term. Type of variable cost curve V.C. due to the law of diminishing returns. Initially, variable costs increase quite quickly as production of the product increases (from 0 to point A), then the growth rate of variable costs slows down, as certain economies of scale occur (from the point A to point IN). After the point IN The law of diminishing returns applies and the curve becomes steeper.


Rice. 5.1. The company's costs of producing products
However, the manufacturer is often interested in the value of average rather than total costs, since an increase in the former may hide a decrease in the latter. The average constants are distinguished ( A.F.C.), average variables ( AVC) and average total costs ( ATC).
Average fixed costs represent fixed costs per unit of production (from the English. average fixed– average constant):
As output increases, average fixed costs decrease, so their graph is a hyperbola. When a small number of units are produced, they bear the brunt of fixed costs. As production volume increases, average fixed costs decrease and their value tends to zero.
Average Variable Costs represent variable costs per unit of production (from the English. average variable– average variable):
They change according to the law of diminishing returns, i.e. have a minimum point that corresponds to the most efficient use of variable resources.
Average total costs (ATS) is the total cost per unit of output (from the English. average total– average overall):
Since total costs are the sum of fixed and variable costs, the average cost is the sum of average fixed and average variables:
Accordingly, the nature of the curve ATC will be determined by the type of curves A.F.C. And AVC. The family of average cost curves is shown in Fig. 5.2.

Rice. 5.2. Family of average cost curves
The most important indicator for characterizing a company's activities is the marginal cost indicator. It reflects the dynamics of the company's costs as the volume of output changes.
Marginal cost (MS) are the costs associated with producing an additional unit of output:
 ,
,
where is the increment in total costs; – increase in production volume.
If the total cost function is differentiable, then marginal cost is the first derivative of the total cost function:
Since the value of total costs is determined as, then
![]() .
.
Three conclusions can be drawn from this expression:
1. if AC increases, then d AC/ dQ> 0, which means MS > AC;
2. if AC decreases, then d AC/ dQ < 0, значит, MS< АС ;
3. at a minimum of average costs d AC/ dQ= 0, therefore, MS = AC.
Based on these considerations and based on the graph of the average total cost function (Fig. 5.2), we will construct a graph of the marginal cost function together with the graph of the average cost function (Fig. 5.3).

Rice. 5.3. Average and marginal cost schedule
The ascending branch of the marginal cost curve ( MS) intersects the curves of the average variables ( AVC) and average total ( ATS) costs at their minimum points A and B. With an increase in output, the difference between average total and average variable costs invariably decreases, and the curve AVC is getting closer to the curve ATC.
5.3. The firm's costs in the long run. Positive and
diseconomies of scale
As mentioned above, in the long run all costs become variable, since the firm can change the volume of all factors of production. She strives to choose the best
combination - one that minimizes costs for a given volume of output. The desire to increase output and at the same time reduce unit costs will push the entrepreneur to expand the scale of the company. As a result, an essentially new, larger enterprise with new production capabilities will be created. In large enterprises, over a long period of time, it becomes possible to use new technologies and significantly automate production. This leads to increased capital costs, but at the same time reduces the use of human labor.
In the long run, we will consider average total costs, the value of which is determined by the average costs for various production options.
Let's assume that the manufacturer increases output, that is, gradually increases the scale of the company and can change the methods of production. In Fig. Figure 5.4 shows the short-run average total costs for different production options. The output at which average total costs are minimal is denoted for the first option by Q 1, for the second through Q 2, and for the third through Q 3. If the firm produces a quantity of output up to , then the first production option should be chosen, since the minimum average cost will be on the curve ATC 1. Transition to the second production method with costs ATC 2 premature as this will only increase costs.

Rice. 5.4. Curve LATC, built on the basis of short-term curves
average costs
Releasing a product from volume to most economically produced at a cost that fits the curve ATC 2, and from the volume go to the curve ATC 3.
Thus, the long-run average cost curve LATC bends around all three short-term curves ATC and shows the minimum production costs with increasing product output.
As can be seen from Fig. 5.4, long-run average total cost curve LATC also has U-shaped like the short-run average cost curve, but this is due to different reasons. The downward portion of the curve showing a decrease in average total costs LATC with increasing production volume, corresponds to increasing returns to scale of production, and the ascending portion of this curve, showing an increase in average costs with increasing production volume, corresponds to diminishing returns to scale.
Some industries are characterized by constant returns to scale. Constant returns to scale occur when the quantity LATC does not depend on the volume of output (Fig. 5.5).

Rice. 5.5. Graph of short-run and long-run average total costs with constant returns to scale
Experience shows that with small production volumes there are increasing returns to scale, with medium volumes there are constant returns, and with large volumes there are diminishing returns. However, it should be noted that in some industries (metallurgy, chemistry and others) large enterprises have an advantage over medium and small ones, and they experience economies of scale, that is, increasing returns to scale. Their main advantages are:
· division of labor, intra-company specialization and cooperation;
· more efficient use of capital;
· possibility of producing by-products;
· availability of discounts on purchases;
· savings in transportation costs.
The list of circumstances that determine the presence of increasing economies of scale can be expanded. However, one way or another, as the enterprise enlarges, sooner or later opposing factors begin to operate:
· bottlenecks appear in the technological process;
· difficulties arise with the sale of large volumes of products;
· problems of completeness of information are increasing;
· the costs of maintaining an expanding administrative apparatus increase, etc.
The action of these factors determines the negative effect of scale, the main way to combat which is to artificially disaggregate the enterprise and provide its individual components with greater independence.
6. MARKET STRUCTURE. PERFECT AND
IMPERFECT COMPETITION
Currently, there are five models of market economies that are used in different countries: American, German, French, Swedish and Japanese. Each model includes different types of markets. The market should be understood as a mechanism of interaction between buyers and sellers, as a result of which an equilibrium market price is established.
The presence of competition is a necessary distinctive feature of market relations. The word “competition” came into the vocabulary of economists from everyday speech, and at first it was used very loosely, with an unsettled meaning. Depending on the methods of its implementation, perfect and imperfect competition are distinguished.
Page 21 of 37
Classification of a company's costs in the short term.
When analyzing costs, it is necessary to distinguish costs for the entire output, i.e. general (full, total) production costs, and production costs per unit of production, i.e. average (unit) costs.
Considering the costs of the entire output, one can find that when the volume of production changes, the value of some types of costs does not change, while the value of other types of costs is variable.
Fixed costs(F.C. – fixed costs) are costs that do not depend on the volume of production. These include the cost of maintaining buildings, major repairs, administrative and management costs, rent, property insurance payments, and some types of taxes.
The concept of fixed costs can be illustrated in Fig. 5.1. Let us plot the quantity of products produced on the x-axis (Q), and on the ordinate - costs (WITH). Then the fixed cost schedule (FC) will be a straight line parallel to the x-axis. Even when the enterprise does not produce anything, the value of these costs is not zero.
Rice. 5.1. Fixed costs
Variable costs(V.C. – variable costs) are costs, the value of which varies depending on changes in production volumes. Variable costs include costs of raw materials, supplies, electricity, workers' compensation, and costs of auxiliary materials.
Variable costs increase or decrease in proportion to output (Fig. 5.2). In the initial stages of production

Rice. 5.2. Variable costs
production, they grow at a faster rate than manufactured products, but as optimal output is reached (at the point Q 1) the growth rate of variable costs is decreasing. In larger firms, the unit cost of producing a unit of output is lower due to increased production efficiency, ensured by a higher level of specialization of workers and more complete use of capital equipment, so the growth of variable costs becomes slower than the increase in output. Subsequently, when the enterprise exceeds its optimal size, the law of diminishing returns comes into play and variable costs again begin to outstrip production growth.
Law of Diminishing Marginal Productivity (Profitability) states that, starting from a certain point in time, each additional unit of a variable factor of production brings a smaller increase in total output than the previous one. This law takes place when any factor of production remains unchanged, for example, production technology or the size of the production territory, and is valid only for a short period of time, and not over a long period of human existence.
Let us explain the operation of the law using an example. Let's assume that the enterprise has a fixed amount of equipment and workers work in one shift. If an entrepreneur hires additional workers, work can be carried out in two shifts, which will lead to an increase in productivity and profitability. If the number of workers increases further, and workers begin to work in three shifts, then productivity and profitability will increase again. But if you continue to hire workers, there will be no increase in productivity. Such a constant factor as equipment has already exhausted its capabilities. The addition of additional variable resources (labor) to it will no longer give the same effect; on the contrary, starting from this moment, the costs per unit of output will increase.
The law of diminishing marginal productivity underlies the behavior of the profit-maximizing producer and determines the nature of the supply function on price (the supply curve).
It is important for an entrepreneur to know to what extent he can increase production volume so that variable costs do not become very large and do not exceed the profit margin. The differences between fixed and variable costs are significant. A manufacturer can control variable costs by changing the volume of output. Fixed costs must be paid regardless of production volume and are therefore beyond the control of management.
General costs(TS– total costs) is a set of fixed and variable costs of the company:
TC= F.C. + V.C..
Total costs are obtained by summing the fixed and variable cost curves. They repeat the configuration of the curve V.C., but are spaced from the origin by the amount F.C.(Fig. 5.3).

Rice. 5.3. General costs
For economic analysis, average costs are of particular interest.
Average costs is the cost per unit of production. The role of average costs in economic analysis is determined by the fact that, as a rule, the price of a product (service) is set per unit of production (per piece, kilogram, meter, etc.). Comparing average costs with price allows you to determine the amount of profit (or loss) per unit of product and decide on the feasibility of further production. Profit serves as a criterion for choosing the right strategy and tactics for a company.
The following types of average costs are distinguished:
Average fixed costs ( AFC – average fixed costs) – fixed costs per unit of production:
АFC= F.C. / Q.
As production volume increases, fixed costs are distributed over an increasing number of products, so that average fixed costs decrease (Figure 5.4);
Average variable costs ( AVC – average variable costs) – variable costs per unit of production:
AVC= V.C./ Q.
As production volume increases AVC first they fall, due to increasing marginal productivity (profitability) they reach their minimum, and then, under the influence of the law of diminishing returns, they begin to increase. So the curve AVC has an arched shape (see Fig. 5.4);
average total costs ( ATS – average total costs) – total costs per unit of production:
ATS= TS/ Q.
Average costs can also be obtained by adding average fixed and average variable costs:
ATC= A.F.C.+ AVC.
The dynamics of average total costs reflects the dynamics of average fixed and average variable costs. While both are decreasing, average total costs are falling, but when, as production volume increases, the growth of variable costs begins to outpace the fall in fixed costs, average total costs begin to rise. Graphically, average costs are depicted by summing the curves of average fixed and average variable costs and have a U-shape (see Fig. 5.4).

Rice. 5.4. Production costs per unit of production:
MS – limit, AFC – average constants, АВС – average variables,
ATS – average total production costs
The concepts of total and average costs are not enough to analyze the behavior of a company. Therefore, economists use another type of cost - marginal.
Marginal cost(MS – marginal costs) are the costs associated with producing an additional unit of output.
The marginal cost category is of strategic importance because it allows you to show the costs that the company will have to incur if it produces one more unit of output or
save if production is reduced by this unit. In other words, marginal cost is a value that a firm can directly control.
Marginal costs are obtained as the difference between total production costs ( n+ 1) units and production costs n product units:
MS= TSn+1 – TSn or MS= D TS/D Q,
where D is a small change in something,
TS– total costs;
Q- volume of production.
Marginal costs are presented graphically in Figure 5.4.
Let us comment on the basic relationships between average and marginal costs.
1. Marginal costs ( MS) do not depend on fixed costs ( FC), since the latter do not depend on production volume, but MS- These are incremental costs.
2. While marginal costs are less than average ( MS< AC), the average cost curve has a negative slope. This means that producing an additional unit of output reduces average cost.
3. When marginal costs are equal to average ( MS = AC), this means that average costs have stopped decreasing, but have not yet begun to increase. This is the point of minimum average cost ( AC= min).
4. When marginal costs become greater than average costs ( MS> AC), the average cost curve slopes upward, indicating an increase in average costs as a result of producing an additional unit of output.
5. Curve MS intersects the average variable cost curve ( ABC) and average costs ( AC) at the points of their minimum values.
To calculate costs and evaluate the production activities of an enterprise in the West and in Russia, various methods are used. Our economy has widely used methods based on the category production costs, which includes the total costs of production and sales of products. To calculate the cost, costs are classified into direct, directly going towards the creation of a unit of goods, and indirect, necessary for the functioning of the company as a whole.
Based on the previously introduced concepts of costs, or costs, we can introduce the concept added value, which is obtained by subtracting variable costs from the total income or revenue of the enterprise. In other words, it consists of fixed costs and net profit. This indicator is important for assessing production efficiency.
1. Average total costs have a minimum value provided that:
a) they are equal to marginal costs;
b) total output is minimal;
c) total output is maximum;
D) variable costs are minimal.
2. Marginal income is:
a) gross income per unit of sales;
b) gross income per unit of production;
c) change in income as a result of changes in revenue per unit of sales;
D) the change in gross income resulting from a unit change in sales.
3. The following statement is correct:
a) the difference between accounting profit and implicit costs is equal to economic profit;
b) the difference between economic profit and accounting profit is equal to explicit costs;
c) the difference between economic profit and implicit costs is equal to accounting profit;
d) the sum of explicit and implicit costs is equal to accounting costs.
4. The change in total revenue when using an additional unit of resource is:
a) marginal product of a factor of production;
b) economic profit;
c) marginal income from a resource;
d) there is no correct answer.
5. The condition for maximizing profit for the company is:
a) equality of gross income and gross costs;
b) equality of average income, average costs and prices;
c) equality of marginal revenue and marginal costs;
d) equality of marginal revenue, marginal cost and price.
6. Each of 20 employees produces on average 100 units. goods. The marginal product of 21 employees was 80 units. What will be the total product equal to using the labor of 21 workers:
7. Of the following costs, the following are implicit:
a) payment for repairs of inactive equipment;
b) interest on current deposits;
c) depreciation of equipment;
d) workers' wages.
8. If a firm has zero production volume, then it:
a) does not incur any costs;
b) has only variable costs;
c) has only fixed costs;
d) there is no correct answer.
9. The value of marginal costs is directly affected by:
a) total costs;
b) variable costs;
c) average fixed costs;
d) fixed costs.
10. Which of the following is not characteristic of perfect competition?
a) the firm's demand curve is horizontal;
b) the firm's demand curve is also its average income curve;
c) the firm's demand curve is also its marginal revenue curve;
D) the firm's demand curve is perfectly inelastic.
11. Which of the following can be explained by the presence of monopoly power?
a) relatively higher prices of Cadillacs compared to Toyotas;
b) high prices for ice cream at the World Figure Skating Championships;
c) relatively high prices for air tickets if the route is served by one airline;
d) answers b) and c) are correct.
12. Monopolistic competition is characterized by the fact that:
a) firms cannot freely enter and exit the market;
b) there is a limited number of firms operating on the market;
c) firms operating in the market produce differentiated products;
d) firms operating in the market do not have complete information about market conditions.
13. Which of the following does not lead to monopoly power?
c) control over the sole source of goods;
d) production and marketing of a product that has many close substitutes.
14. Opportunity costs are:
a) actual costs expressed in money;
b) the sum of actual and implicit costs;
c) implicit costs accrued to the operating expenses of the company;
D) the difference between actual and implicit costs.
15. At the point of minimum marginal costs, average costs should be:
a) decreasing;
b) increasing;
c) permanent;
d) minimal.
16. Which of the following factors causes an increase in the firm’s variable costs:
a) an increase in the interest rate on a bank loan;
b) increase in local taxes;
c) increase in prices for raw materials;
D) an increase in the rent of copiers for the firm.
17. Oligopoly is a market structure where:
a) a large number of competing firms producing a differentiated product;
b) a small number of competing firms;
c) a large number of competing firms producing a homogeneous product;
d) all of the above are incorrect.
Solve problems
1. The work of the notional enterprise for the past period was characterized by the following indicators (per month):
expenses for raw materials and materials - 200 thousand rubles;
transportation costs – 25 thousand rubles;
expenses for paying management personnel – 52 thousand rubles;
labor costs for production workers – 180 thousand rubles;
rental of premises – 10 thousand rubles.
Calculate the average variable and average constant costs of production of the enterprise's products if the output volume is 10 thousand pieces per month.
2. Determine the amount of profit of the enterprise if MC = 60 den. units, AC = 5 den. units, TS = 300 den. units, at P = 6 days. units
3. An entrepreneur opened a pharmacy kiosk. He hired two pharmacists with a salary of 6 thousand rubles per month. The rent for the premises was 10 thousand rubles per month. The remaining obvious costs are 50 thousand rubles. He invested 200 thousand rubles in his business, losing 1% per month, which he would have had with another investment of capital, and also refused to work with a salary of 15 thousand rubles. per month. The kiosk brings in income of 90 thousand rubles. per month. Determine the amounts of accounting and economic profits.
What is meant by social costs?
When is average total cost at its minimum?
Which of the following definitions of variable cost is incorrect?
What is the shape of the total cost curve?
What is the shape of the average fixed cost curve?
What are the total costs?
What costs are variable?
What costs are considered fixed?
What is meant by opportunity cost?
1. These are payments for purchased resources.
2. It is the cost of social expenditure.
3. This is the cost of economic costs in another enterprise producing the same products.
4. This is the cost of alternative uses of the same resources.
1. Costs that a company incurs even when products are not produced.
2. Costs that do not change either in the short or long periods.
3. Expenses of fixed capital for the acquisition of production space and equipment.
4. Costs of purchasing raw materials.
1. Interest on bank loans and raw material costs.
2. Rent and cost of equipment.
3. Wages, cost of electricity and consumables.
4. All incurred costs necessary to produce products.
1. From accounting costs and implicit costs.
2. The costs of organizing a company plus the costs of producing products.
3. From private and public costs.
4. Of fixed and variable costs.
1. Parabola shape.
2. The form of a hyperbola.
3. Constantly increasing curve.
4. A line parallel to the x-axis.
1. The same as the variable cost curve, raised along the y-axis by the amount of fixed costs.
2. Parabola shape.
3. Constantly increasing line.
4. At first a decreasing line, but from a certain volume of production it begins to increase.
1. Marginal costs are the additional costs associated with producing an additional unit of output.
2. Marginal cost is the increase in total costs divided by the increase in production volume.
3. Marginal cost is a value dependent on fixed costs.
4. Marginal cost is a value dependent on variable costs.
1. When they are equal to marginal cost.
2. When total output is minimal.
3. When total output is maximum.
4. When variable costs are minimal.
1. Cost of production.
2. Costs of training, medical care, road construction, etc.
3. Individual costs of the enterprise plus the costs of society to overcome the negative consequences of production.
4. Environmental protection costs.
1. The opportunity cost of factors of production owned by the owner of the enterprise.
2. Costs associated with the use of production factors owned by the enterprise.
3. Payments that might not have happened.
4. Equipment maintenance costs (depreciation)